In like a lion, out like a lamb – An investor who looked at their statement on August 1st and again on the 31st might naturally assume that markets drifted gradually higher last month amid sleepy summer trading. The reality, however, is that the first few trading days saw the most volatile equity market since 2020, with the VIX spiking to a 4-year high alongside a rapid drawdown of ~6% in the S&P 500. Although equity markets have now broadly recovered and are above or near their previous highs, we think this spike in volatility should not be ignored, and it serves as an important reminder of the importance of avoiding reactionary decision making in periods of market turbulence.
As for what happened, the tidiest explanation is that an unwinding carry trade was to blame. The most common carry trade strategy is to borrow in yen (at very low rates) and invest in US or other markets where interest rates or investment prospects are stronger – a key risk to the investor of course is that the borrowing currency strengthens, and that’s exactly what happened with the Japanese yen just prior to the sell-off. An unexpected rate hike from the Bank of Japan (this is the first hiking cycle for the BoJ since 2007) led to a rapid ~7% appreciation in the yen, which caught many investors pursuing this strategy off-guard, and some were forced to unwind their positions rapidly. When you combine some weaker than expected U.S. jobs data and the carry trade unwind with low summer trading liquidity (turns out traders take time off too), the abrupt drop and rebound doesn’t look quite so anomalous.
Nonetheless, we’re still generally cautious when it comes to the economic outlook going forward. One of our core investing principles is to be skeptical of excessive optimism when markets are climbing (and of excessive pessimism when markets are falling), so we’re applying that skeptical eye to a stock market that is near an all-time high. Despite this caution, we see many excellent opportunities available today, particularly in an energy sector where many companies are generating record levels of cash even while paying down debt. Our view is that the greatest risk in equities lies with the companies whose valuations are extremely elevated and require virtually unprecedented levels of revenue growth to justify. These companies are highly dependent on persistent exuberance from investors, where funds continue piling in to the fastest climbing stocks under the assumption that future profits will justify the eye-watering multiples being demanded at current levels.
We are happy to avoid the speculation that comes with chasing this type of trade, and the first few days of August have given us a timely reminder of the downside that comes with this type of speculation. For now, we see equity markets on solid footing for the medium term, but believe more defensive sector positioning is appropriate at a time when economic data is likely to continue slowing.
—
Terms
-
VIX: The Chicago Board Options Exchange Volatility Index. This index is the most cited quantitative measure of volatility of the S&P 500.
-
Carry Trade: a strategy where the investor borrows money in a low-rate regime (often Japan) and invests it in a higher rate environment to earn the interest rate differential or take advantage of some other investment opportunity. This trade assumes stable FX rates, so the key vulnerability for these investors lies in the change between the borrowing and investing currencies. If the borrowing currency strengthens relative to the investing currency, the investor can lose money quickly, particularly if additional leverage has been applied to the strategy.
-
Multiples: in investing, this is a generic term to describe how cheap or expensive a stock is, and is generally synonymous with “valuations”. The most followed valuation multiples are price-to-earnings and price-to-sales, though many others exist.
—
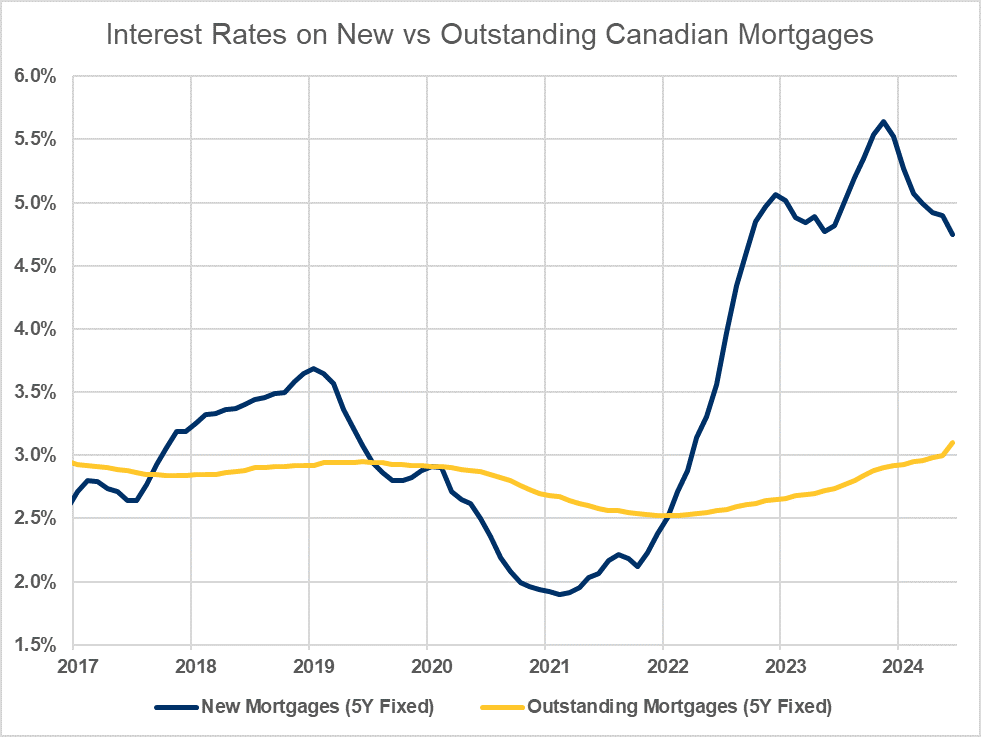
Chart of the Month
Although variable-rate mortgage holders have been feeling the squeeze from higher rates for nearly two years, the picture is more nuanced when it comes to the much larger 5-year fixed rate mortgage holders. Although new 5-year mortgages are being initiated at rates of nearly 5%, the average mortgage rate for all outstanding 5-year fixed rate mortgages is only marginally higher than it was in 2019. With many homeowners buying or refinancing in 2020 and 2021, the next two years will see a wave of refinancing that is likely to see the average mortgage rate climb sharply, even if the Bank of Canada continues to cut interest rates.
—
Research Round-up
Articles, podcasts, blogs, and other investing and economics pieces that we found interesting this month.
-
Fed Rate Cuts on the Horizon – the latest edition of Global Insight Weekly explores the historical performance of equities in rate cut cycles.
-
Hyun Song Shin on How Big the Yen Carry Trade Really Is – Hyun Song Shin, economic advisor and head of research at BIS, discusses the yen carry trade and its role in the volatility spike at the beginning of August.
-
Canadian GDP growth higher than expected in Q2 but details are soft – RBC Economics explores the latest GDP print for Q2-2024 and why the higher-than-expected headline number isn’t quite as strong as it appears.
—
Data Digest
A selection of key economic data-points for the month.
| Country | Event | Period | Survey | Actual | Prior | Surprise |
| USA | Change in Payrolls | Jul | 175,000 | -114,000 | 206,000 | -61,000 |
| Comments: A much weaker than expected U.S. jobs report for the month of July added fuel to the market sell-off sparked by the carry trade unwind at the beginning of the month. It does follow a series of weakening economic data-points, but was also skewed by the impact of Hurricane Beryl. | ||||||
| Country | Event | Period | Survey | Actual | Prior | Surprise |
| Canada | Net Change Employment | Jul | 25,000 | -2,800 | -1,400 | -27,800 |
| Comments: The Canadian economy unexpectedly shed jobs when a gain of ~25k was the aggregate expectation from economists. Canadian economic data has been deteriorating faster than U.S. comparables this year, and the Canadian unemployment rate is now 2.1% higher (6.4% vs 4.3%) than it is in the U.S. | ||||||
| Country | Event | Period | Survey | Actual | Prior | Surprise |
| USA | CPI (Headline) | Jul | 3.0% | 2.9% | 3.0% | -0.1% |
| Comments: U.S. headline year-over-year CPI dipped below 3% for the first time in over 3 years in July. When combined with a weaker than expected jobs report, the Fed has plenty of runway to begin their cutting cycle in September. | ||||||
| Country | Event | Period | Survey | Actual | Prior | Surprise |
| Canada | CPI (Headline) | Jul | 2.5% | 2.5% | 2.7% | -0.2% |
| Comments: Canadian headline year-over-year CPI fell by 0.2% in July, matching economists’ expectations. The modestly lower CPI readings and weaker jobs growth in Canada pushed the Bank of Canada to cut twice this summer, before the Fed has even started. | ||||||
RBC Dominion Securities Inc.* and Royal Bank of Canada are separate corporate entities which are affiliated. *Member-Canadian Investor Protection Fund. RBC Dominion Securities Inc. is a member company of RBC Wealth Management, a business segment of Royal Bank of Canada. ®/™ Trademark(s) of Royal Bank of Canada. Used under license. © 2023 RBC Dominion Securities Inc. All rights reserved.