In this month’s note:
- Unspent or uninvested dollars decay over time – this gradual debasement is not a bug of the system, it’s the way it was designed
- Market prices are set not just by intrinsic value, but by scarcity
- Scarcity assets like gold provide a key source of return and diversification
Recently my wife and I took the children out for ice cream on a hot day, and despite their best efforts each one was soon fighting a losing battle against the streams of fast melting ice cream dripping onto the pavement. I remarked to my wife that this reminded me of how modern fiat financial systems operate; she didn’t seem particularly interested in exploring this concept further, so I’ll do it here instead.
Many of our valued clients have heard us speak about the financial system as a “fistful of sand.” Regardless of the metaphor, the point is the same: dollars and other fiat currency (i.e., not backed by tangible assets) melt and decay over time if not invested productively. The supply of money grows constantly, debasing the value of each dollar and eroding purchasing power over time. Debasement and inflation aren’t identical, but they’re closely linked.
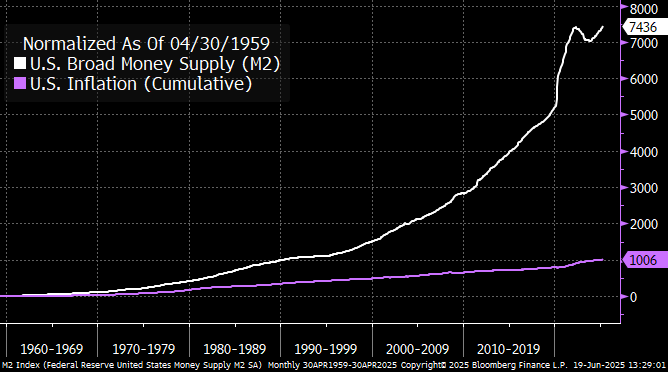
Consider the chart below showing M2 money supply, which is a rough measure of the number of U.S. dollars sloshing around in the system. In the middle of the post-war baby boom, there was about $0.25 trillion circulating globally. Today that figure is closer to $22 trillion! Most of this growth was created not by money printing from the Fed, but from lending by financial institutions through our fractional reserve banking system (a topic for another day).
Chart 1: The money supply is nearly 75x larger than it was 65 years ago

Source: Bloomberg
This growth has averaged roughly 6.5-7.0% over that time and has been remarkably steady through different monetary regimes (other than periods of very high growth like 2020/2021). What this means is that the number of dollars in the system doubles almost every 10 years, so the half-life of a dollar’s intrinsic value is about a decade.
There is no scope or appetite for this phenomenon to stop. In fact our entire financial system has been built on the assumption that this will continue indefinitely. But it’s also important to distinguish debasement from inflation. While money growth has averaged ~6.7% annually, inflation has averaged well under half that rate (~2.5%) in the last twenty years. The reason we’ve been able to sustain money growth (debasement) at a much higher pace than price growth (inflation) is that we have become more productive over time through advancements in technology, trade, and efficiency. Most people are fine with debasement as long as inflation stays under control – the former is nebulous and difficult to define, whereas we’re reminded of the latter every time we buy a carton of eggs.
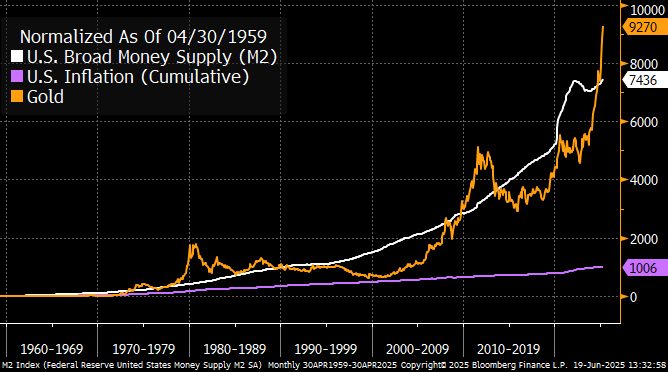
If we add inflation to our chart and switch the y-axis to “% growth”, we can see that while there are 74x as many dollars in the system today as in 1959, prices in aggregate are only 10x higher (although with some *very* significant outliers such as housing & tuition).
Chart 2: Money supply growth has significantly outstripped inflation
Source: Bloomberg
This discrepancy – 74x the dollars with just 10x the price – is a testament to our collective productivity and capacity to generate wealth. However, as investors we must also understand the nature of debasement and why “scarcity assets” are such an important part of a diversified portfolio.
We often view price and value as an indication of something’s importance, but this is only superficially true. Imagine you were offered you an equal volume of clean water or pure gold – which would you take? The value assigned to gold is significantly higher than the water: about half a cent for a liter of water in Toronto versus $2 million for an equivalent volume of gold. Yet clean water is significantly more important to our survival than gold, so why is it valued nearly half a billion times higher? The answer is scarcity: gold is extremely scarce in a way that clean water is not (for those of us fortunate enough to live in a place with modern water filtration systems). If Lake Ontario was full of gold you can be sure it would not cost $3,400/oz.
Prices and valuations are *extremely* sensitive to scarcity, and our money supply is designed to become less scarce over time. Scarcity assets like gold provide a long-term hedge against this phenomenon in a way that cash in a bank account simply cannot. If we add gold to our chart, we can see that bullion is not just keeping pace with inflation, it’s keeping pace with currency debasement!
Chart 3: Gold has a history of vastly outpacing inflation in the long-run
Source: Bloomberg
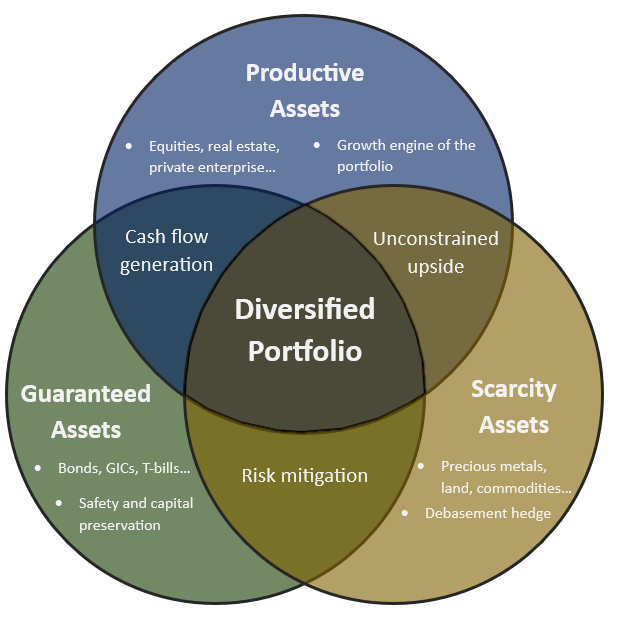
Gold is certainly not the only scarcity asset out there (land, art, collectibles, brand power, etc) and scarcity assets are not the only way to take advantage of the half-life of money. However, it’s our view that most investors’ portfolios focus exclusively on the green and blue circles in the Venn diagram below, which ultimately neglects a key source of diversification and return.
Right now the U.S. government is pushing its federal debt and deficits to eye-watering levels, and from a purely arithmetic viewpoint, the only way out is through even faster debasement (after all, debasing the value of currency benefits debt-holders, and there’s no bigger debtor in the world than the U.S. government). If we refer back to the melting ice cream metaphor, we can think of higher projected deficits as a forecast for even hotter weather in the future. It’s for this reason that debasement is a key consideration in our investment selection process, because we believe scarce and productive real assets will prove to be much more resilient going forward.
For better or worse, these are the rules of the game, and we aim to take advantage of the half-life of money for our clients wherever possible.