- U.S. large capitalization stocks have been garnering all of the attention in 2024 and for good reason.
- While this may surprise some, the TSX is thus far on track for an above average return year, but is being dwarfed by the U.S.
- Analysts are expecting similar rates of earnings growth for both the S&P 500 and TSX over the next two years.
- Canadian investors are currently paying significantly less for a similar amount of forward looking growth.
- The valuation differential is even more stark if interest rates are taken into account, with the U.S. market approaching late 1990s levels on this metric.
- The best portfolio isn’t always the one with the highest return, but the one we can commit to for the long term.
All of the attention from investors and the media continues to be on the U.S. market, and for obvious reasons. U.S. large capitalization stocks measured by the S&P 500 have been on a tear, outperforming rival country benchmarks handily at the mid-way point of 2024. Canada hasn’t been spared. While the TSX has put up a respectful six month performance, it remains well behind the S&P 500. It wasn’t always this way. You don’t have to look back too far to see a period where U.S. stocks were concerning and technology stocks were downright scary. The year was 2022. That was the year where famously “nothing worked” as rising interest rates wreaked havoc on nearly all asset classes, but the TSX held in well in comparison as commodity stocks were lifted by inflation.
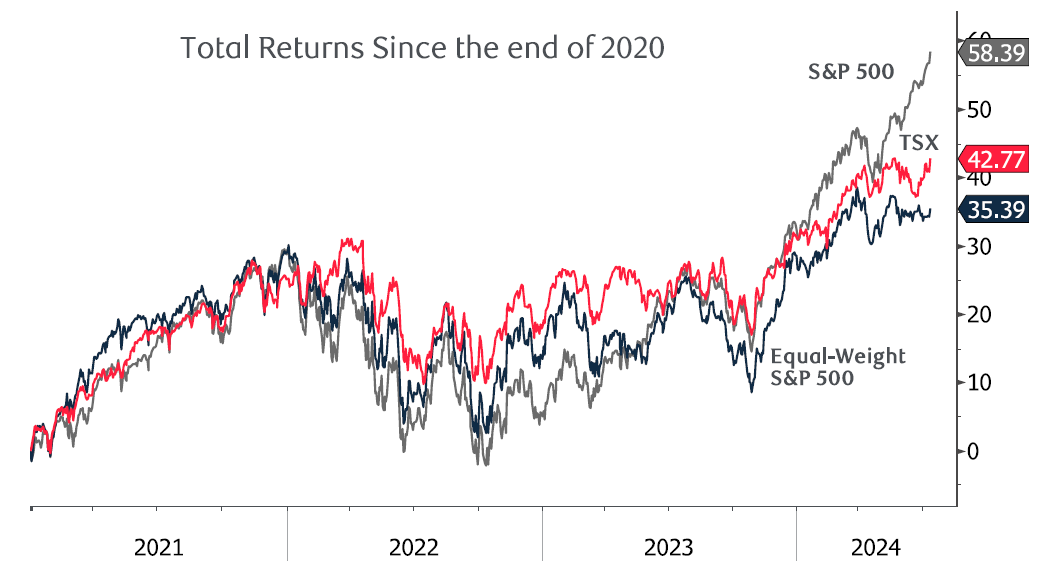
S&P 500 outperformance shifted into high gear this year…
The ebb and flow of performance is more clearly seen in the chart below, which tracks the total return of the S&P 500, TSX and the Equal-Weighted S&P 500 which keeps all 500 stocks at the same weight as opposed to the largest names in the index being 5%+. We feel this is more representative of the performance of the “typical” stock. From the end of 2020 to the beginning of this year, all three indices had put up a similar 4-year performance number, but this year has seen the S&P 500 break loose from the pack, at least for now.
Source: Bloomberg
… driven by the usual suspects
As a handful of big technology stocks continue to climb at the expense of nearly everything else, 2022 feels a long way away. This has started to get under the skin of Canadian investors (us included!). We have spent the last little while zooming out the lens a bit and have made some observations on the Canadian market vis-à-vis the U.S. which we think provide some helpful context for long-term investors. First off, it is pretty clear (at least to us) that the U.S. market’s premium valuation has been driven by the big technology stocks. As it stands today, 29% of the market capitalization of the S&P 500 is in the top five companies, a 40+ year high. To put this in perspective, back at the peak of the last technology bull market, the number was 18%.
Source: Bloomberg
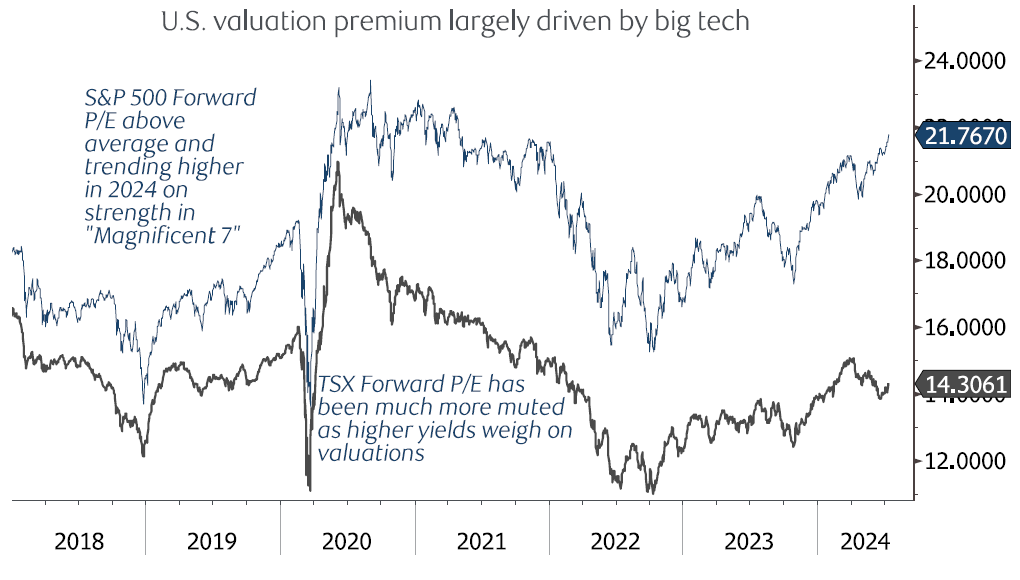
U.S. premium justified based on past growth, but what about the future?
One of the key principles of equity investing is that markets tend to pay a premium (as measured by the price/earnings, or P/E, ratio) for higher earnings growth. This is one of the reasons the U.S. market trades at a premium – it has seen healthy earnings growth. We also know that markets look relentlessly forward, and this is where things get a bit more interesting. When we look at cumulative earnings growth forecasts for the next two calendar years, the analysts come up with near identical numbers for both the S&P 500 and the TSX, at 23% and 22%, respectively. That means if these forecasts bear fruit, investors are paying a significant premium for U.S. stocks for a similar level of earnings growth. This may reflect that investors have a higher degree of confidence in the U.S. growth number, but we find this dichotomy interesting.
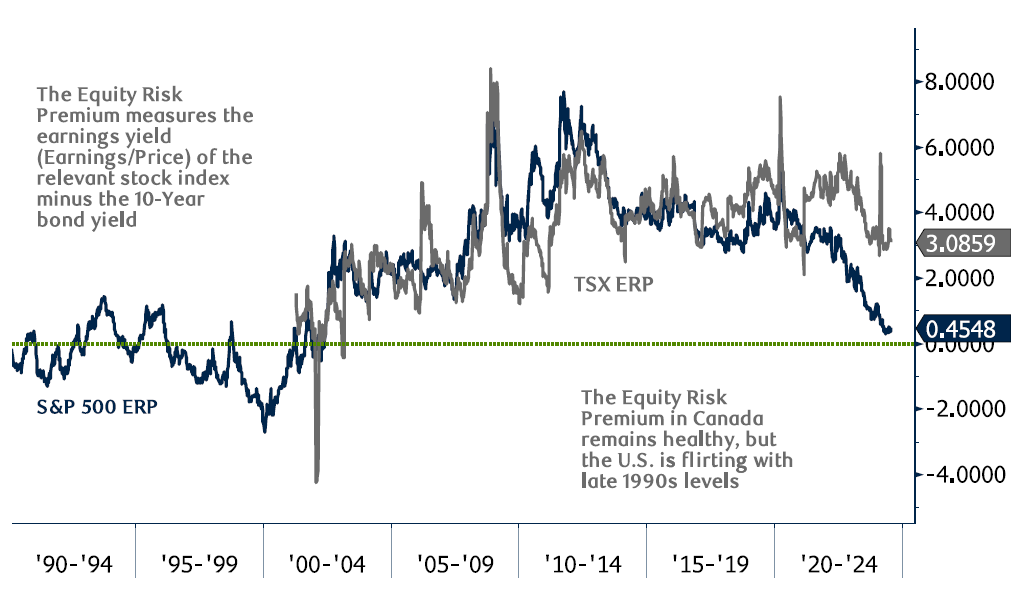
Some metrics have U.S. valuations at 1990s-type levels, with the TSX more reasonable
The price/earnings ratio is probably the most well known valuation metric out there, but we can take it one step further. If we take the inverse of the P/E ratio and divide earnings by price, we come up with what is called the “earnings yield”, which puts a stock valuation metric into fixed income terms so we can look at the whole portfolio through the same lens. If we subtract the relevant government bond yield from the earnings yield, we are left with the excess return we can expect to earn on stocks versus bonds, known as the “equity risk premium”. As the name suggests, this is the extra return we can expect to earn on stocks compared to government bonds. On this metric the difference between Canadian and U.S. stocks is even more striking. Canada’s equity risk premium is in line with levels seen over the past decade in the low 3% range, but the U.S. number is back to 1990s-type levels approaching zero.
Source: Bloomberg
Who knows what the future will bring, but it is rare that one strategy works forever
We present the observations above not in the spirit of making a bold call about the next leg in the market, but as a framework for thinking about long-term asset allocation. As the old saying goes, you can never have enough of a winning trade. Hindsight is 20/20 and we would all love to have even more exposure with anything to do with artificial intelligence. At least that’s how we feel today. World-changing trends can deliver strong returns but rarely do so in a straight line and are often accompanied by episodes of hair-raising volatility. In our view, the portfolio that will be the most successful over time isn’t always the one with the highest absolute return. A portfolio that returns 100% a year with a 50% drop each year along the way doesn’t do us a lot of good if we get shaken out of our seat each time we lose half our money. The most successful portfolio offers a combination of healthy returns AND a level of volatility we can withstand. As you may have guessed, because of this no two ideal portfolios are the same!
The Harbour Group
416-842-2300
Putting you first, every time, to help you navigate the complexities of managing your wealth. All of our team members, all of our resources, all of our collective insight: ALL FOR ONE: YOU™.
The information contained herein has been obtained from sources believed to be reliable at the time obtained but neither RBC Dominion Securities Inc. nor its employees, agents, or information suppliers can guarantee its accuracy or completeness. This report is not and under no circumstances is to be construed as an offer to sell or the solicitation of an offer to buy any securities. This report is furnished on the basis and understanding that neither RBC Dominion Securities Inc. nor its employees, agents, or information suppliers is to be under any responsibility or liability whatsoever in respect thereof. The inventories of RBC Dominion Securities Inc. may from time to time include securities mentioned herein. RBC Dominion Securities Inc. and its affiliates may have an investment banking or other relationship with some or all of the issuers mentioned herein and may trade in any of the securities mentioned herein either for their own account or the accounts of their customers. RBC Dominion Securities Inc. and its affiliates also may issue options on securities mentioned herein and may trade in options issued by others. Accordingly, RBC Dominion Securities Inc. or its affiliates may at any time have a long or short position in any such security or option thereon. Mutual funds are sold by RBC Dominion Securities Inc. There may be commissions, trailing commissions, management fees and expenses associated with mutual fund investments. Read the prospectus before investing. Mutual funds are not guaranteed, their values change frequently and past performance may not be repeated. RBC Dominion Securities Inc.* and Royal Bank of Canada are separate corporate entities which are affiliated. *Member CIPF. ®Registered Trademark of Royal Bank of Canada. Used under licence. RBC Dominion Securities is a registered trademark of Royal Bank of Canada. Used under licence. ©Copyright 2019. All rights reserved.