
Central Bank Divergence, U.S. Election, and the Rotation Trade
In July, we saw the U.S. broad market indices breaking all-time highs before pulling back shortly after. The pull back was primarily a result of the rotation from Big Tech to U.S. small cap companies fueled by an anticipation of interest rate cuts in the coming months.
Q2 reporting season is underway. 41% of the S&P500 companies have reported so far with 78% exceeding analysts’ EPS estimates. However, the earnings beats are only averaging 4.4% above estimates. The current blend of actual as well as estimated earnings growth for Q2 year over year is at 9.8%.
In June, the Bank of Canada announced its first interest rate cut and then again in July lowering the key benchmark rates from 5% to 4.5% while the Federal Reserve held interest rates steady. The key explanation for this is that the Canadian economy has been weaker than the U.S, which provides more room for the Canadian central bank to cut interest rates early. The current GDP estimates projects a rebound in the Canadian economy next year alongside a deceleration in the U.S. in 2025.
Lastly, we are approximately 100 days until the U.S. election. Many expect a Trump administration will be more lenient on regulating domestic business and will be more likely to extend the Trump era tax cut. While her agenda is still emerging, many expect Harris to continue Biden’s policies and take a more ‘centrist’ approach.
U.S. Economic Check-up
U.S. economic resilience continued in Q2 with real GDP rising at a 2.8% annualized rate, double the growth rate of the previous quarter and well ahead of consensus for a 2.0% gain. This strong GDP growth fueled the soft-landing narrative and pushed back recession concerns. That said, several leading indicators have turned negative, and it bears watching at a juncture where the stock markets have recently hit all time highs. It is still reasonable to expect the U.S. economy to slow down from here; the crucial question is whether a soft landing can be achieved with well timed interest rate cuts, or if we will see a much feared hard landing which will take the markets by surprise.
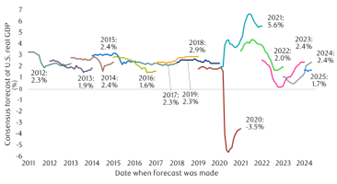
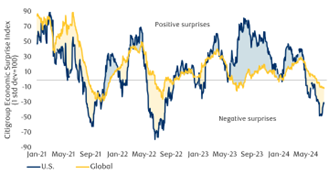
As of May 2024. Sources: Consensus Economics, RBC GAM As of July 2024. Sources: Citigroup, Bloomberg, RBC GAM
U.S. Elections
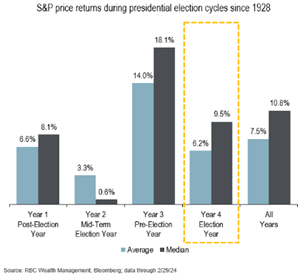
While it takes time for the markets to observe, process, and price in new policies, it is useful to keep a few market stats in mind for U.S. elections. Election periods do come with heightened market volatilities. However, since 1928, 70% of the time, the markets end positively. There has been no statistical significance when it comes to the relationship between market returns and the party in power. Although particular to this year’s election, an extension of the corporate tax cut is more likely under Republican control than Democrats.

The conventional wisdom is that a Trump Administration is positive for the stock markets. This makes sense given how well the markets performed during his first presidency. However, a second Trump term may not follow the same path as the first for a few reasons. In the face of a mounting fiscal deficit, a further reduction of corporate tax rate may prove to be difficult and unpopular with his base. If his plans for tariffs are implemented, it’s likely that nations may retaliate with their own tariffs, specifically on the U.S. Big tech names which have been crucial in fuelling market growth.
The Small Cap Rotation Trade
In July, we’ve seen some profit taking in the large cap technology names and a strong burst of leadership in U.S. small cap companies. This has come as a welcoming relief as the small cap segment has lagged in performance in recent years. Historically, small cap companies tend to outperform prior to the first interest rate cut. To sustain this rally, companies’ reported earnings will need to demonstrate growth. In a healthy bull market, the market leadership needs to broaden out from a small, concentrated list of names. The recent small cap rally may be a step in the right direction.
Small Caps Undervalued vs. Large Caps on Both Median and Average P/E Multiples
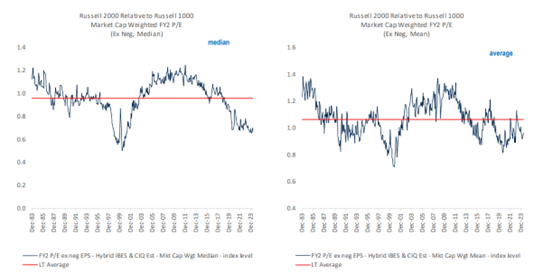
Source: RBC US Equity Strategy, Russell, S&P Capital IQ/ClariFI, CIQ estimates, IBES estimates; as of July 2024
Rita Li works with professionals, business owners and high net worth families to provide tailored investment advice, risk management and financial planning. Her team comprises of professionals with in-depth taxation, insurance, and legal expertise; together, they deliver a high standard of service to clients. Rita is a Chartered Financial Analyst CFA® and Certified Financial Planner CFP®. Rita holds her MBA from Richard Ivey School of Business.