Quarterly commentary - Summer 2024
In our Q1 commentary, we discussed 3 risk factors that would influence the performance of Q2; central banks’ fight against inflation, the cadence of growth of the US economy, and rising geopolitical conflicts.
As of the latest reading of Canadian and US data, it seems that central banks are on track to bring inflation back to the 2% target. In Canada, inflation is around 2.7% while in the United States, the rate is also falling, albeit at a slower rate; inflation has fallen to 3.0%, its lowest level in 3 years.
In terms of the growth of the US economy, although it is slowing down, it is still expanding, and it remains the economy with the best short-term growth prospects. Consumer spending is still favorable, and it is showing good results in terms of job creation. This good relative performance allows US companies and Canadian companies that export part of their products and services to post satisfactory profits.
As for geopolitical conflicts, they unfortunately continued to mark the news, without much effect to financial markets. It remains a risk that must continue to be monitored.
Performance at June 30th 2024
The second quarter of 2024 was another very favorable one. The results in CAD of the various indices for the quarter ended June 30th 2024: -0.5% for the Canadian S&P/TSX index, +5.4% for the US S&P 500 index and -0.4% for the Europe-Asia-Far East index. Interest rates decreased slightly over the second quarter of the year, leading to a marginally positive performance in fixed income. The benchmark FTSE TMX Canadian Bond Index posted a positive return of 0.9%. The appreciation of the US dollar against the Canadian dollar had a positive impact of +1.0% on US strategies over the same period.
Balanced portfolio returns in Canadian dollar are around +1.5% for the last three months and over the last twelve months are generally between +11.0% and +13.0% in CAD.
Global Equity Perspective - Trees don’t grow to the sky
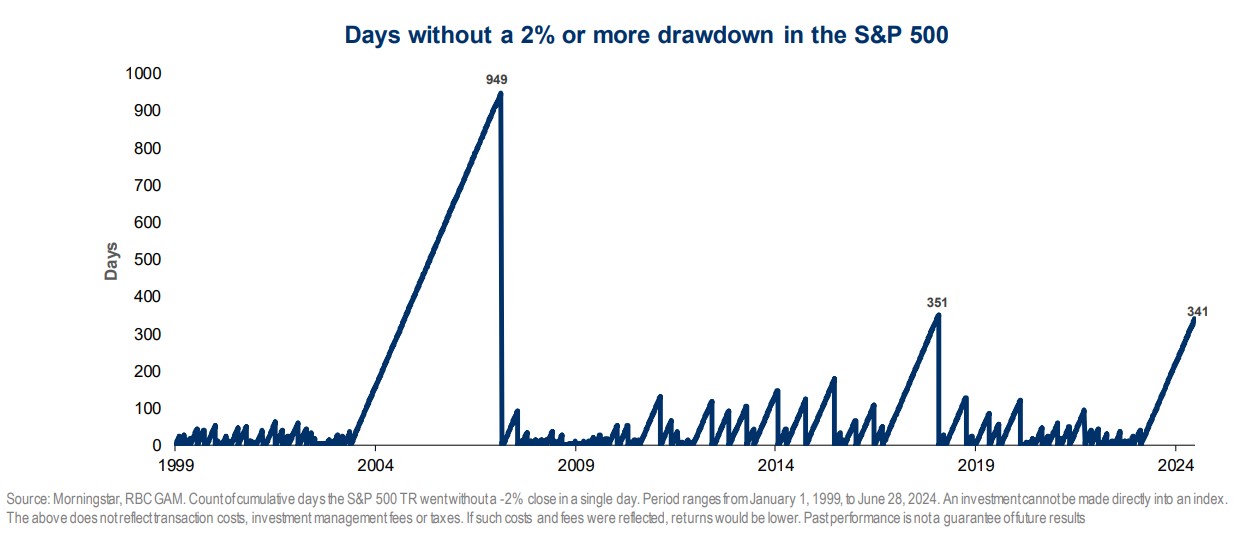
So rare it is that we go through a prolonged period with such low volatility that the market has begun to be characterized as complacent. Since 1999, there have only been 2 other periods where the S&P500 index has held out this long without recording a daily drop of at least 2%.

As noted in the above chart, markets have been relatively docile over the last 12 months (341 days); the S&P 500 did not register a daily drop of 2% or more. A rarely occurring and favorable situation for investors.
AI has propelled a “magnificent few” to trade at extremely rich valuation multiples, leaving all the rest at much more reasonable valuations.
But they may not be as inexpensive as they appear as heavy investment in AI looks to become a costly price of staying competitive for almost all businesses without any certainty of a profitability payoff.
A soaring S&P 500 price-to-earnings multiple by itself won’t define the limits of the market advance, in our view. But when combined with optimistic/complacent investor sentiment readings and interest rates that are almost double what they averaged in the pre-pandemic decade, a cautious, watchful approach is called for.
A P/E ratio of 20x has always been regarded by investors as the line beyond which the market was “overvalued” or “living on borrowed time”. And with good reason: the market has rarely traded beyond that level. But now it is.
However, in our opinion, despite today’s much higher P/E multiple, the degree of valuation concern expressed by investors and commentators alike has become unusually subdued. It is certainly running at a much lower pitch and volume than during much of the previous decade when the S&P500 was mostly six to eight multiples cheaper.
The contrast between P/Es in 2012-2019 and where we find them today in 2024 is even starker when interest rates are factored in. The 10-year US Treasury yield averaged roughly 2.3% through most of the pre-pandemic decade. Today, it’s closer to 4.3%. Higher bond yields would normally lead to a lower P/E multiple for the market; instead, we have a markedly higher P/E.
What seems to be lulling investors into a complacent acceptance of today’s elevated valuations is the much-discussed idea that P/Es are only high because of the outsized impact of a small, very select group of extravagantly priced mega-cap tech and tech-related stocks, which are seen to be the clearly dominant beneficiaries of fast-emerging developments in artificial intelligence (AI). When the so-called Magnificent 7 (Apple, Amazon, Alphabet/Google, META, Microsoft, NVIDIA, and Tesla) are taken out of the calculation, what remains—the S&P 493 they have been dubbed—are trading at a seemingly more benign 18.4x earnings. (Foreign markets—Canada’s S&P/TSX, MSCI UK, and MSCI Europe—are even cheaper nearer 16x.) But 18x earnings was regarded as fully valued back in the pre-pandemic, much-lower-interest-rate world.
The way to reconcile this constructively would be to have earnings grow fast enough to offset the heavier drag of higher interest rates. However, faster profit growth would normally require faster GDP growth. Some think that is what AI will make possible. However, not everyone agrees. The Congressional Budget Office (CBO), a non-partisan agency, regularly prepares long-term forecasts of the U.S. economy for the U.S. Congress. Its latest, published in March, sees real GDP growth settling on either side of 2.0% for the coming 10 years and slowing to 1.6% after that.
Presumably, the CBO economists are just as aware of the emergence of AI as everybody else and perhaps more informed as to its potential to produce faster GDP growth. Their expectations appear underwhelming to us.
So, faced with the possibility AI won’t ride to the rescue, we are left with P/Es ranging between uncomfortably high at 24x for the S&P 500 and fully valued at 18x for the underpowered S&P 493 (the 500 largest companies minus the Magnificent Seven).
Longer term, unusually high market P/E ratios typically point to below average equity returns measured over the following decade. The fact that the excessive market multiples are attributable to one overwrought sector or a handful of heavyweight favorites has not tended to mitigate that outcome.
Investors have had to contend with substantially overweighted high-fliers in the past, such as the “Nifty Fifty” in the early 1970s, the energy and commodity stocks in the late 1970s, the tech sector leading up to the “tech wreck,” and the financials heading into the global financial crisis. Not just the overvalued leaders but the majority of other stocks also suffered when the tide eventually turned.
We don’t believe markets are finished moving higher. But thinking about risk appetite and having a plan for becoming more defensive when conditions dictate are things to contemplate in the coming months. We believe stocks are no longer compellingly valued and investor sentiment is increasingly complacent. The combination argues for a cautious, watchful approach on the part of investors.
U.S. debt dilemma – No quick fixes and no catastrophes
Time and again, we receive several questions from many of you about the level and sustainability of US debt, and although the figures are astronomical, it is important to put them in context. We thought it pertinent to provide you with a summary of the in-depth article by our colleague from Minneapolis, Atul Bhatia on US debt, taken from the Global Insight June 2024 publication.
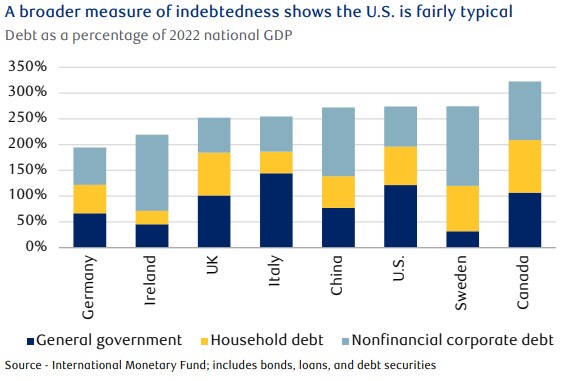
U.S. government debt has been rising rapidly since the global financial crisis of 2008, but broader measures of borrowing across the economy have remained relatively stable and on par with other developed economies.
The U.S. debt has always been a divisive matter. Not only is there disagreement on its causes and fixes, but no one can seem to agree if, or when, the federal debt becomes a concern.
Both sides of the argument have a problem, in our view. Folks saying that the amount of U.S. borrowing will lead to a calamity have to deal with a 40-year track record of being wrong, the counter-example of the Japanese economy functioning with debt levels nearly twice that of the U.S. today, and the fact that no sovereign has defaulted when borrowings are exclusively in its own fiat currency under its own law.
For those saying the debt is irrelevant, the path is no easier. The major stumbling block is the apparent absurdity of their argument: somehow, somewhere it must matter how much money we have borrowed to fund our current spending. After all, “there is no such thing as a free lunch” is not a bad starting premise for the study of economics.
The combined debt load across U.S. corporations, households, and government entities was around 260% at the end of 2022, the last year for which International Monetary Fund stats are available. This puts the U.S. essentially at the median debt level for large, developed economies.
Put differently, if the U.S. were to dedicate its entire annual production to debt repayment, it would take about 2.6 years to wipe out all the money that households, businesses, and government entities have borrowed. That’s essentially the same timeline faced by the UK or Sweden, and it’s substantially less than Canada, where every dollar of productivity capacity has the burden of more that $3 of debt outstanding.

In closing, we invite you to contact us should you have any questions about your financial situation, and above all, since our summers tend to be relatively short, we wish you an enjoyable one.
We hope to see you soon,
Mathieu & Anthony
This information is not investment advice and should be used only in conjunction with a discussion with your RBC Dominion Securities Inc. Investment Advisor. This will ensure that your own circumstances have been considered properly and that any action is taken based upon the latest available information. The strategies and advice in this report are provided for general guidance. Readers should consult their own Investment Advisor when planning to implement a strategy. Interest rates, market conditions, special offers, tax rulings, and other investment factors are subject to change. The information contained herein has been obtained from sources believed to be reliable at the time obtained but neither RBC Dominion Securities Inc. nor its employees, agents, or information suppliers can guarantee its accuracy or completeness. This report is not and under no circumstances is to be construed as an offer to sell or the solicitation of an offer to buy any securities. This report is furnished on the basis and understanding that neither RBC Dominion Securities Inc. nor its employees, agents, or information suppliers is to be under any responsibility or liability whatsoever in respect thereof. The inventories of RBC Dominion Securities Inc. may from time to time include securities mentioned herein. RBC Dominion Securities Inc.* and Royal Bank of Canada are separate corporate entities which are affiliated. *Member-Canadian Investor Protection Fund. RBC Dominion Securities Inc. is a member company of RBC Wealth Management, a business segment of Royal Bank of Canada. â / ™ Trademark(s) of Royal Bank of Canada. Used under licence. © 2024 RBC Dominion Securities Inc. All rights reserved.
