
Vendredi 14 janvier 2022, notre conférence annuelle sur la gestion de portefeuilles se terminait à Toronto. Quatre jours de réunions et de présentations d'experts internes et externes. Analystes, stratèges et collègues gestionnaires de portefeuille. Et leur conclusion était unanime. 2022 allait être une année positive. Bien sûr, il y avait déjà des signes d'inflation, encore une certaine perturbation de la chaîne d'approvisionnement et une grande partie du monde était toujours préoccupée par la Covid (c'est-à-dire la Chine). Mais les 3 années précédentes avaient été très bonnes et 2022 allait encore être une telle année.
Avançons jusqu'au vendredi 13 janvier 2023, à la récente conférence annuelle sur la gestion de portefeuilles. Rita et moi avons quitté Toronto sous une tempête et nous avons pris le train pour rentrer à Montréal. Et donc beaucoup de temps pour discuter et réfléchir. Et ce qui est ressorti de ces quatre jours de réunion, c'est que cette fois-ci chaque personne que nous avions rencontrée était négative quant aux perspectives pour l'année à venir. Maintenant, je ne sais pas comment se terminera l'année 2023. Comme tout le monde, je vois les taux d'intérêt, la guerre en Ukraine, la dette publique, diverses pertes de crédit et une récession américaine imminente. Mais que fera le marché au cours des prochains mois ?
Je n'en ai aucune idée.
Et la raison en est que les performances à court terme du marché boursier sont principalement déterminées par la psychologie. En d'autres termes, la question de savoir si nous aurons une année positive ou négative dépend plus du sentiment des investisseurs que de toute autre chose. En tout cas, plus que les données financières réelles.
Prenons l'exemple de 2021 contre 2022. La première année a été très bonne et la suivante a été incroyablement mauvaise. Et pourtant, le bénéfice par action du S&P 500 a augmenté de 9,35 % en 2022. On aurait pu s'attendre à un bon marché boursier. Mais au lieu de cela, le S&P500 a baissé de 19,44 %. La raison en est la psychologie des investisseurs. À la fin de 2021, les investisseurs étaient prêts à payer 25,5 fois les bénéfices du S&P500. Douze mois plus tard, ces mêmes investisseurs étaient prêts à payer 18,8 fois les bénéfices du même S&P500. Pour le TSX60, les bénéfices ont augmenté de 25,5 %, mais le multiple payé est passé de 17,6 en 2021 à seulement 12,8 en 2022.
En fait, 2022 s'est avérée être une année historique. Oui, les indices boursiers mondiaux ont baissé (l'indice MSCI World de -19,46 %, le Nasdaq de -33,10 % et le TSX 60 de -8,66 %, aidé par le pétrole), mais c'est le marché obligataire qui en a fait une année historique. Selon le Wall Street Journal, ce fut la pire année pour les obligations depuis 1842! Vraiment la pire de l'histoire. À quel point ? Les bons du Trésor américain à 30 ans ont baissé de -32,1 %, les obligations à long terme du gouvernement canadien de -27,9 % et l'indice obligataire universel DEX de -11,72 %. Des chiffres effrayants en effet, surtout pour du revenu fixe.
Malgré tout, il y a quelques bonnes nouvelles pour les investisseurs.
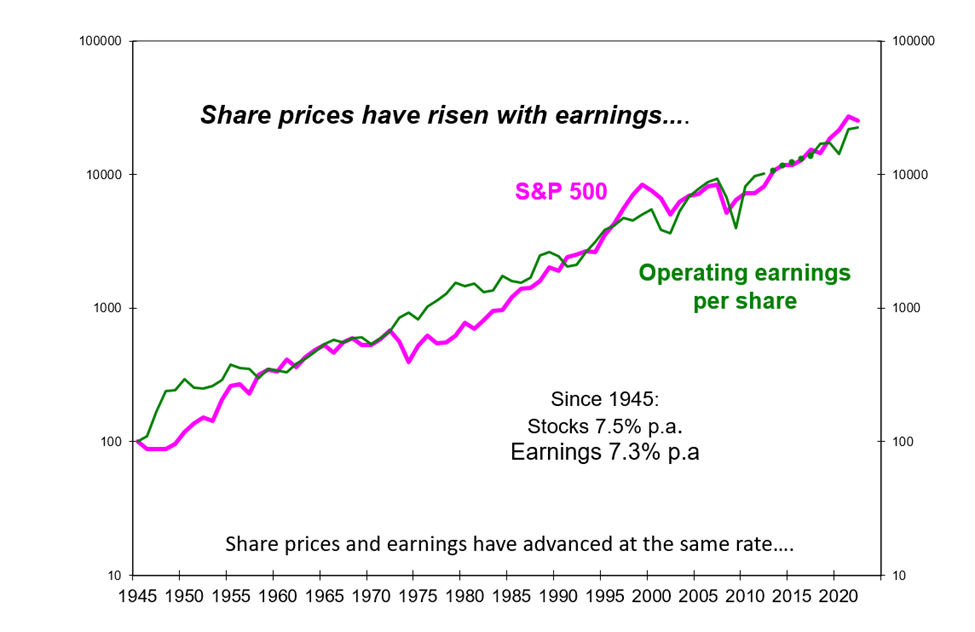
La première bonne nouvelle est qu'à long terme, la performance du marché est dictée par les bénéfices. En d'autres termes, si une entreprise double ses bénéfices en 10 ans, l'action devrait se porter très bien. Le graphique suivant illustre bien ce phénomène. Depuis 1945, le S&P500 a essentiellement évolué dans une seule direction (hausse) et a suivi les bénéfices des entreprises (tableau 1).
Des recherches ont montré que les marchés boursiers sur une base de 120 mois sont 85% du temps guidé par les bénéfices. En revanche, sur une base de 12 mois, 85 % de la performance est déterminée par le sentiment, illustré par l'expansion ou la contraction des multiples. Et la croissance des bénéfices a été largement régie par la croissance économique (tableau 2).
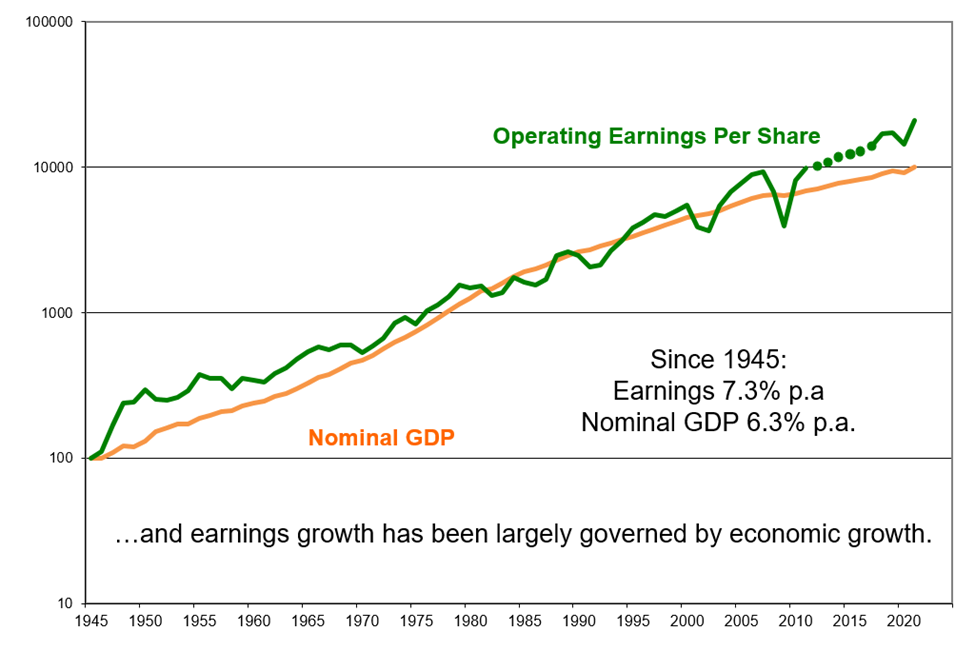
L'écart entre la croissance du PIB nominal et la croissance des bénéfices peut être attribué au fait que le PIB inclut les gouvernements, les entreprises et les populations. Les bénéfices, quant à eux, ne dépendent que des entreprises. On se concentre donc davantage sur la croissance. Mais la direction est la même. Vers le haut.
La question est donc la suivante : où voyez-vous la croissance économique dans quelques années ? Et avec cette réponse, je vous dirai où le marché boursier va aller. Alors, éteignez CNBC, BNN et autre. Oubliez les opinions et les sentiments de vos amis.
Commencez plutôt par une estimation crédible de l'ampleur du PIB nominal. Une source qui n'a rien à vous vendre et qui n'essaie pas de se faire élire est le Congressional Budget Office (CBO). Il publie régulièrement ses projections de base sur l'évolution de l'économie pour l'année en cours et les dix années suivantes. Et leur projection pour le PIB réel ajusté à l'inflation est une croissance comprise entre 2,7 % et 1,8 %. Étant donné que le PIB réel est le PIB nominal corrigé de l'inflation, il serait important de savoir à quoi ressemblera l'inflation. À l'heure actuelle, l'inflation diminue et devrait se situer autour de 2,5 % à 2,75 % en moyenne au cours des dix prochaines années.
Donc, avec une économie en croissance, bien que plus lente qu'avant 2008, nous devrions nous attendre à ce que les marchés boursiers connaissent également une croissance. Mon travail consiste donc à m'armer des estimations décrites ci-dessus et à passer du temps à trouver les entreprises qui seront dominantes dans leur secteur économique dans 10 ans. Pour surperformer, je devrais également profiter des périodes de faiblesse du marché pour en ajouter d'autres.
Ce qui m’amène à la deuxième bonne nouvelle. Au 31 décembre 2022, notre performance à long terme demeure enviable. Notre rendement annuel moyen sur 10 ans pour notre Global 35 est de 12,75 %, contre 10,02 % pour les indices concernés, ce dont je suis très fier. Mais je reste humble, car une certaine part de chance est toujours présente dans de tels chiffres. Notre rendement sur 1 an en 2022 est de -6,97%. Je n'en suis pas heureux, mais il faut s'y attendre de temps en temps. La question est donc comment pouvons-nous générer de tels rendements à long terme ? Et la réponse est: en investissant, en tant que copropriétaires, dans un groupe d'entreprises suffisamment restreint pour que nos grands gagnants puissent vraiment faire profiter le portefeuille, mais en même temps suffisamment diversifié pour que mes erreurs ne le détruisent pas. Nous visons donc entre 35 et 45 entreprises.
Des entreprises comme Quincaillerie Richelieu, CP Rail, Metro, Parker Hannifin, Novo Nordisk, Visa et Microsoft. Les paramètres fondamentaux que sont le rendement des capitaux propres (ROE), l'historique des dividendes et les marges concurrentielles historiques sont de bons points de départ. Ensuite, quel est le prix à payer pour une telle entreprise ? Examinons-en quelques-unes.
Le rendement des capitaux propres est une mesure bien connue des performances d'une entreprise. Il s'agit du bénéfice net divisé par les capitaux propres ordinaires et privilégiés. En d'autres termes, plus il est élevé, mieux c'est. Des sociétés comme Novo Nordisk et Microsoft ont toutes un ROE élevé (respectivement 70,6 et 39,0 en moyenne au cours des 5 dernières années).
Comme vous le savez, les dividendes sont payés en espèces. Lorsque nous parlons de rendement du dividende, nous divisons simplement le dividende en espèces par le prix actuel de l'action. Cette distinction est importante, car le dividende en espèces est ce que vous recevez dans vos poches. Et si le conseil d'administration d'une société augmente son dividende, c'est plus d'argent qui vous est versé. De plus, comme le dividende est payé en espèces, c'est de l'argent dont la société ne dispose pas pour d'autres choses. Donc, augmenter le dividende est un signe de force. Cela signifie que nous ferons si bien demain que nous, la société, pourrons verser ce dividende en espèces tout en continuant à gérer l'entreprise (croissance, investissement, remboursement des dettes, etc.). Et comme on ne peut pas demander le remboursement du dividende et qu'il est difficile de le réduire, l'augmentation du dividende est un signal positif important.
Ainsi, lorsque des entreprises comme Metro (29 années consécutives) et Parker Hannifin (66 années consécutives) augmentent leur dividende, cela en dit long.
Prenez les 29 ans d'expérience de Métro. Depuis 1994, malgré 3 récessions, l'attaque terroriste du 11 septembre, la destitution de deux présidents américains, les soucis de l'an 2000, une crise financière mondiale et une épidémie mondiale, Métro a augmenté son dividende. Les membres du conseil d'administration et les dirigeants se sont-ils inquiétés à un moment donné de quelque chose qui pourrait avoir un impact négatif sur la santé financière de Metro ? C'est presque certain. Après tout, ils sont humains et souffrent des mêmes doutes et inquiétudes que le reste d'entre nous. Mais les activités sous-jacentes sont solides, l'entreprise n'a jamais dépassé l'effet de levier et elle a donc été (et continuera probablement à l'être) optimiste pour l'avenir et à augmenter son dividende. Pendant 29 années consécutives... Au cours des 10 dernières années, le dividende a augmenté en moyenne de 15 % par an.
Est-ce que cela fait de Métro une valeur immanquablement certaine ? Non, bien sûr. Prenons la période allant de mi-2007 à début 2008 (tableau 3).

La grande crise financière n'a pas encore atteint son paroxysme. Et de toute façon, pourquoi une chaine d’épiceries imploserait-elle comme elle l'a fait ? Une baisse de 50 % en 8 mois (la ligne verte). Assez pour ébranler la confiance de quiconque. Surtout si on le compare au TSX 60 (la ligne verte). Ce dernier fait alors beaucoup mieux et alimente la croyance que l'on ne peut pas battre les indices, n'est-ce pas ? Je suis certain que beaucoup d’investisseurs ont vendu pendant ces mois sombres entre juillet 2007 et mars 2008. Nous ne l'avons pas fait et les résultats finaux parlent d'eux-mêmes (tableau 4).

Nous avons un nouveau titre dans notre portefeuille Global 35, la compagnie Parker-Hannifin. Son graphique ressemble beaucoup à celui de Métro, avec de nombreuses périodes où le S&P 500 a fait beaucoup mieux (société américaine donc nous le comparons à cet indice). Mais sur une période de temps plus longue, c'est loin d'être le cas.
Parker-Hannifin est un fabricant diversifié de systèmes de technologies de mouvement et de contrôle. Elle les fournit à une grande variété de clients commerciaux, industriels et aérospatiaux. Et bien que peu d'analystes la couvre (et qu'aucune société canadienne ne le fasse), nous l'apprécions pour son historique de dividendes (rappelez-vous les 66 années consécutives d'augmentation du dividende), son prix raisonnable, son rendement des capitaux propres élevé et son impressionnant flux de trésorerie disponible. Mais au Canada du moins, peu de gens semblent avoir entendu parler de cette société. Espérons qu'il en sera ainsi et que nous pourrons continuer à l'acheter pendant longtemps.
Tout cela pour dire que, quels que soient les nuages à l'horizon, un investisseur prudent, logique et à long terme trouvera toujours une bonne place pour investir ses économies. Le marché peut-il être volatil à l'avenir ? Oui, bien sûr. En fait, c'est une quasi-certitude.
Mais comme je l'ai dit à plusieurs reprises, la volatilité des marchés est comme les turbulences en avion. Les deux sont inconfortables, mais pas mortelles. Ce qui est mortel en matière d'investissement, c'est avant tout de paniquer et de vendre jusqu'à ce que les choses se calment et qu'il soit temps de réinvestir. J'en ai entendu parler de nombreuses fois, mais je n'en ai jamais vu la preuve que quelqu’un l’avait réussi. Jamais. Et si quelqu'un d'aussi accompli que Warren Buffett ne semble pas pouvoir le faire (son portefeuille d'investissement a perdu 56 milliards de dollars cette année), sachez que celui qui prétend l'avoir fait et pouvoir le refaire est coupable de grande exagération ou de mensonge pur et simple.
Alors, que devriez-vous faire ? Nous sommes toujours en guerre en Ukraine, l'inflation reste élevée, les taux d'intérêt (bien que très raisonnables par rapport à l'histoire) ne sont pas près de baisser et pourraient même augmenter, le drame du plafond de la dette aux États-Unis va très bientôt dominer le cycle des nouvelles financières et les bénéfices globaux devraient diminuer avec le ralentissement de l'économie. De plus, RBC et ses collègues de Bay Street et Wall Street prévoient une récession à un moment donné au cours des 12 prochains mois.
Je ferais ce qui suit.
- Réévaluez si votre horizon temporel est toujours celui d'un investisseur à long terme. Disons 7 ans et plus. Veuillez noter que je ne parle pas de votre âge, mais plutôt de votre horizon temporel. J'espère que nous avons tous encore plusieurs années devant nous, donc l'horizon temporel dépend plus du moment où vous avez besoin de votre argent que de votre âge. Si vous avez 75 ans, que vous êtes en bonne santé, que votre maison et vos jouets sont payés, vous avez besoin d'argent pour vos dépenses quotidiennes et vous avez du temps devant vous. Mais si vous avez 25 ans et que votre argent doit servir à verser un acompte sur une maison dans 3 ans, votre horizon temporel est à court terme.
- Soyez honnête quant à votre tolérance aux soubresauts. Je considère la volatilité comme de la simple turbulence, mais ce n’est peut-être pas votre cas. Et ce n'est pas grave. L'important est de le reconnaître. Donc de s’avoir quel type d'investisseur vous êtes vraiment. Et d'ajuster votre allocation d'actifs en conséquence, sans craindre la FOMO.
- FOMO (Fear Of Missing Out). La peur de manquer quelque chose. Se comparer aux gains supposés de l'ami/du voisin/du beau-frère/du collègue à succès que nous avons tous. Le même type de personne (généralement un homme) qui savait à l'avance que la marijuana, les bitcoins et Cathy Wood allaient devenir GROS. Et il a vendu, bien sûr, au bon moment. Il a fait une tonne d'argent... Bien sûr. Je dirai simplement que se comparer est la source de la plupart des misères quand il s'agit d'argent et de finance.
- Révisez votre plan financier. Oui, cet exercice fastidieux et ennuyeux dont franchement vous n'étiez pas certain... Il sera votre carte routière. Où en êtes-vous sur la voie de l'indépendance financière ? Dans mon secteur, nous employons souvent des mots compliqués, mais au fond, votre plan doit vous démontrer si vos aspirations futures sont réalisables. D'où viendra l'argent ? Revenus de placement, pensions de l'État, retrait de capital ? Avez-vous de la place pour des dépenses supplémentaires, ou devriez-vous essayer de faire quelques économies ?
- Notre relation avec vous est avant tout une conversation. Vous partagez avec nous vos désirs, votre vision de l'avenir et vos objectifs. Nous sommes chargés de les traduire en VOTRE gestion de patrimoine (gestion de portefeuille, planification et révision, création d'un héritage pour la prochaine génération). Mais dans son expression la plus simple, c'est une conversation. Avec les allers-retours normaux d’aune conversation. Nous devons nous faire confiance, et nous devons être transparents les uns envers les autres. Un peu comme une longue marche sur l'axe du temps et de l'argent, si vous voulez.
- Cette longue marche permettra au miracle des intérêts composés de se produire. Imaginez une action capable de faire croître son dividende chaque année à perpétuité (ou du moins pendant les 20 prochaines années). Si l'on se projette dans l'avenir, un actionnaire pourrait théoriquement récupérer l'intégralité de son coût de base au fil du temps tout en restant propriétaire de l'action sous-jacente. Et les entreprises qui peuvent augmenter régulièrement leurs dividendes sont également susceptibles d'enregistrer une hausse du cours de leurs actions. L'ajout de titres à revenu fixe comme lest (ballast) et source de capital pour les prochaines années est également très utile.
Cette formule classique, souvent décriée, mais jamais remplacée, avec un plan financier adéquat est la clé. Surtout en ces temps de volatilité.
En terminant, nous avons beaucoup grandi comme équipe ces dernières années, principalement grâce à vous et à votre confiance. Vos dépôts d'argent et vos références de votre famille et de vos amis sont le meilleur compliment que nous puissions recevoir. Merci.