The Last Worthless Evening
This week, we reflect on a party that took place in Hollywood some 37-years ago. That night, Michelle Pfeiffer, fresh off playing a witch in the Witches of Eastwick, attended a party (location uncertain) with her friend and Eastwick costar Jack Nicholson. Pfeiffer’s marriage had recently broken up and while Nicholson was known as a ladies’ man, there seems to be agreement that Pfeiffer and Nicholson, separated by 21-years, were there purely as friends.
As Pfeiffer smoked a cigarette and Nicholson scanned the room from a couch, another man walked by and upon seeing Pfeiffer, seemingly worked up the courage (if you are not familiar with 1980s Michelle Pfeiffer, working up the courage to talk to her may have been the most courageous act in the history of the human race) to ask her for a smoke. Apparently, the delivery of the request was, umm, bungled, and Pfeiffer provided the lung dart, but in such a fashion that suggested – this (waving hand up and down her body) is not for you. The man took the cigarette and then skulked off, with Nicholson remarking, “well played, Henley.”
This “Henley” was Don Henley, who after a decade-long run as lead singer of The Eagles (and recently divorced) had embarked on a massively successful solo career. A year after the party, Henley would release his third solo album – The End of the Innocence – which would go on to be Henley’s best-selling solo venture with ~6 million in sales worldwide. The third single on this album – The Last Worthless Evening – would tell the story of a woman who had broken up with her husband, who met a man, who had also recently broken up with his wife. The man acknowledges that the woman is not yet ready for a new relationship, but that he remains madly in love with her and if he could just get the courage to walk up to her and express his feelings that, “this is the last worthless evening, that you'll have to spend, just gimme a chance to show you how to love again.” Of course, Henley asked for a cigarette, so we will never know how this might have gone.
Cliffhanger
Times such as these certainly test our mettle as investors. Back in a simpler time when Bob Barker was just about the coolest guy on planet earth, The Price is Right used to have a game called “Cliffhangers” in which a contestant had to guess the price of three items and a guy (apparently known as “Yodely Guy”) would gradually climb up a mountain with his steps determined by how close the contestant got to the price of each item. If the contestant was too far away on the three guesses, Yodely Guy would plunge off the cliff to his death (we suppose, as Bob never really made that part clear).
We loved Cliffhangers so much that we used to use something similar in client events with the mountain instead representing the wall of worry that the stock market had to climb. We used to note (to rousing applause, we might add) that it was exceedingly rare for the wall of worry to plunge the market into some sort of significant disrepair with most “plunges” of a normal 5-15% variety. In fact, as a colleague recently noted, 10% declines in the S&P 500 (such as the one that just occurred) happen, on average, about once per year, while 15%+ declines happen, on average, about once every other year. Larger declines – 20%+ - are a once every three- or four-year occurrence (the last one was 2022 for reference and before that 2020 and before that 2018) and truly big drawdowns – 30%+ - occur only when there is a U.S. recession.
We have fielded a fair number of calls over the past few weeks. Folks are worried and we totally get it – the wall of worry is steep. It’s at times like these that we like to dust off some interesting prior work we have done. With that in mind, let’s hail the return of the perfect timer.
Return of the Perfect Timer
Let’s imagine we were at the dawn of 1952. Four investors have a plan. Let’s look at each:
- Dollar/Day Lady: The first investor has decided that she is going to put a dollar into the S&P 500 every trading day of the year (on average there are 252 trading days in a year). She does this every day through Friday, March 21st, 2025.
- Monthly Lump Sum Guy: The second investor has a similar plan to the first, but instead of a dollar/day, he takes 1/12th of his annual sum of $252 and invests it at the beginning of every month.
- Annual Lump Sum Lady: The third investor decides to save all of her dollars for an annual contribution.
- The Perfect Market Timer: Okay, this guy is special. He was born with the ability to know with absolute certainty when the S&P 500 had hit a level that it would never trade lower than again. He too has one dollar/day to invest, but he saves them until one of these lows has been achieved and then he invests in one lump sum. We realize this may be a bit confusing, so let’s look at an actual example:
S&P 500 on January 1, 1952: $23.77
S&P 500 on September 14, 1953: $22.71
# of Trading Days: 445
On 9/14/53, the S&P 500 hit $22.71 – it has never traded lower than this value since that date. Our perfect timer has accumulated $445 since we started, and he invests it all at this price. Our $1/day investor is already down ~6% by then, while our monthly investor is down ~4% and our annual investor is up ~4%.
The perfect timer then waits again – this time for only 5-days – when the market, after a pop over the four days following the 15th, settles back at $22.88 on September 21st, which again marks a level that the market will never see again – so, our perfect timer adds $5 more to the market.
This keeps occurring for the next 73-years – basically, every time the S&P 500 hits a level on the downside that it has not experienced since, the perfect timer takes his accumulated funds and adds them to what he has in the market. Let’s look at what this might look like in a chart:
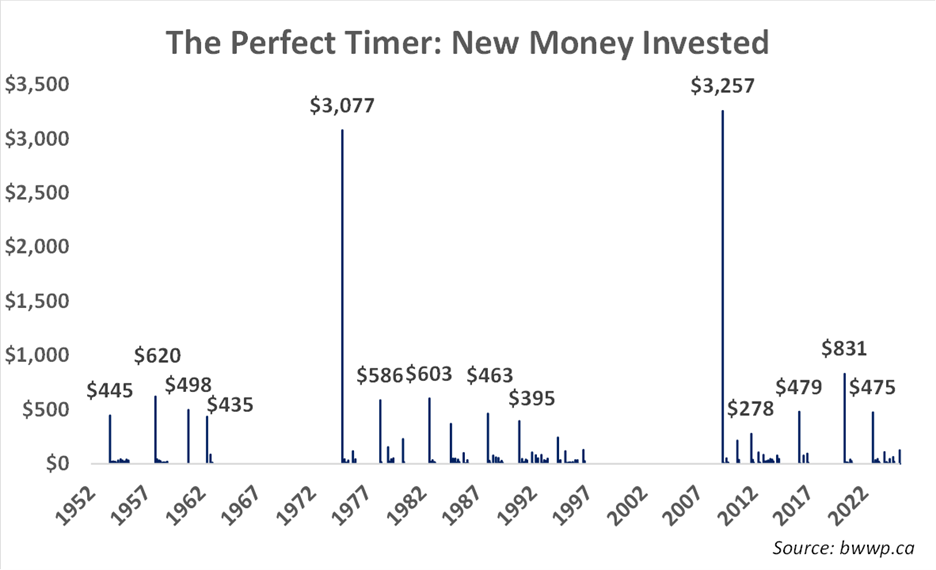
Notice that there are some big gaps in the chart. For example, on December 19, 1962, the S&P 500 hit $62.58. Let’s look at what it did over the next 12-years:

For 3,077 trading days, the S&P did not establish a new permanent low. Thus, our perfect timer saved and saved until the day finally came and invested $3,077 in one shot at this extremely attractive level, while our other investors lost significant dollars during this dark ~12-year period.
Okay, you may now be asking the question – what’s the point of this? Our perfect timer is clearly killing it, while our other investors, who lack his predictive abilities, are struggling. With that in mind, let’s look at how each investor did over the ~73-year period:

Wait, what? Yes, our perfect timer does best, but only by ~20-basis points annually. In other words, the power of absolutely perfect foresight moves the needle, but not by much. Now, one might argue – but the perfect timer could earn some money investing in bonds when he is saving his dollar for that perfect day, but stocks have traditionally had a higher dividend yield than the interest rates on bonds (although, not more recently), so let’s call this a wash. In case you were wondering, here’s what it looks like decade by decade when comparing the perfect timer with the $1/day investor:

Think about it – even the 2020’s, which not only saw the COVID-induced meltdown of Feb/March 2020 and the 20%+ decline in the S&P in 2022 only leads to ~1% of annual outperformance for the perfect timer.
What does this mean for our approach? First and foremost – we believe that investors should stay largely invested. While we add and subtract exposure to our investments at various times, we are not in any way trying to time the market. Rather, we focus on the data, especially as it relates to U.S. economy (a topic we have touched on many times in the past) to gauge, among other things, the risks of a U.S. slowdown or recession. As negative data accumulates, we are apt to trim our exposures with the idea that we will likely get the opportunity to add back exposure to good businesses at distressed prices. We are not trying to catch the bottom in these stocks, but rather a valuation level that strongly suggests the position will be profitable over a 3-5 year period from the level we added exposure. We will often be early, but as the above data suggests, being early is not going to hurt us much in the long run.
As for the current situation, while the data remains decent, we have chosen to ease back exposure as we have rarely experienced uncertainty at the levels in which it currently sits. Should things settle down and given the still underlying strength of the U.S. economy, we are likely to add back some exposure. We acknowledge this could be at higher prices, but sometimes there is an art to this as opposed to a science.