Stagflation lite exacerbates growing K-shape divergence
Heading into 2026, we see a US economy that is increasingly on track for a stagflation lite scenario: GDP growth running below the typical 2% trend, while inflation remains uncomfortably high.
Still, we think the most important economic stories lie beneath the surface of a standard outlook like this. Indeed, 2025 can be characterized by particular uncertainty as tariffs, immigration policy, and data distortions contributed to an increasingly foggy environment.
Structural disruptions to this economic cycle will persist as demographic forces and immigration policy play an increasingly important role in the labor market. At the same time, cyclical tariff disruptions will fade, but not without changing the way businesses and consumers behave.
Separating structural forces from the cyclical ones will be paramount. We lay out the five main components for stagflation lite we expect in 2026.

Stagflation lite to worsen: Inflation not just a tariff story
It’s been nearly eight months since Liberation Day (April 7), and we continue to maintain our view that tariffs will weigh on the labor market and put upward pressure on inflation—reinforcing that the US economy is experiencing stagflation lite. But the inflation story in 2026 is not just about tariffs. It’s a confluence of factors that will create an uncomfortable environment where we forecast core inflation will remain stubbornly above 3% y/y for most of the year.
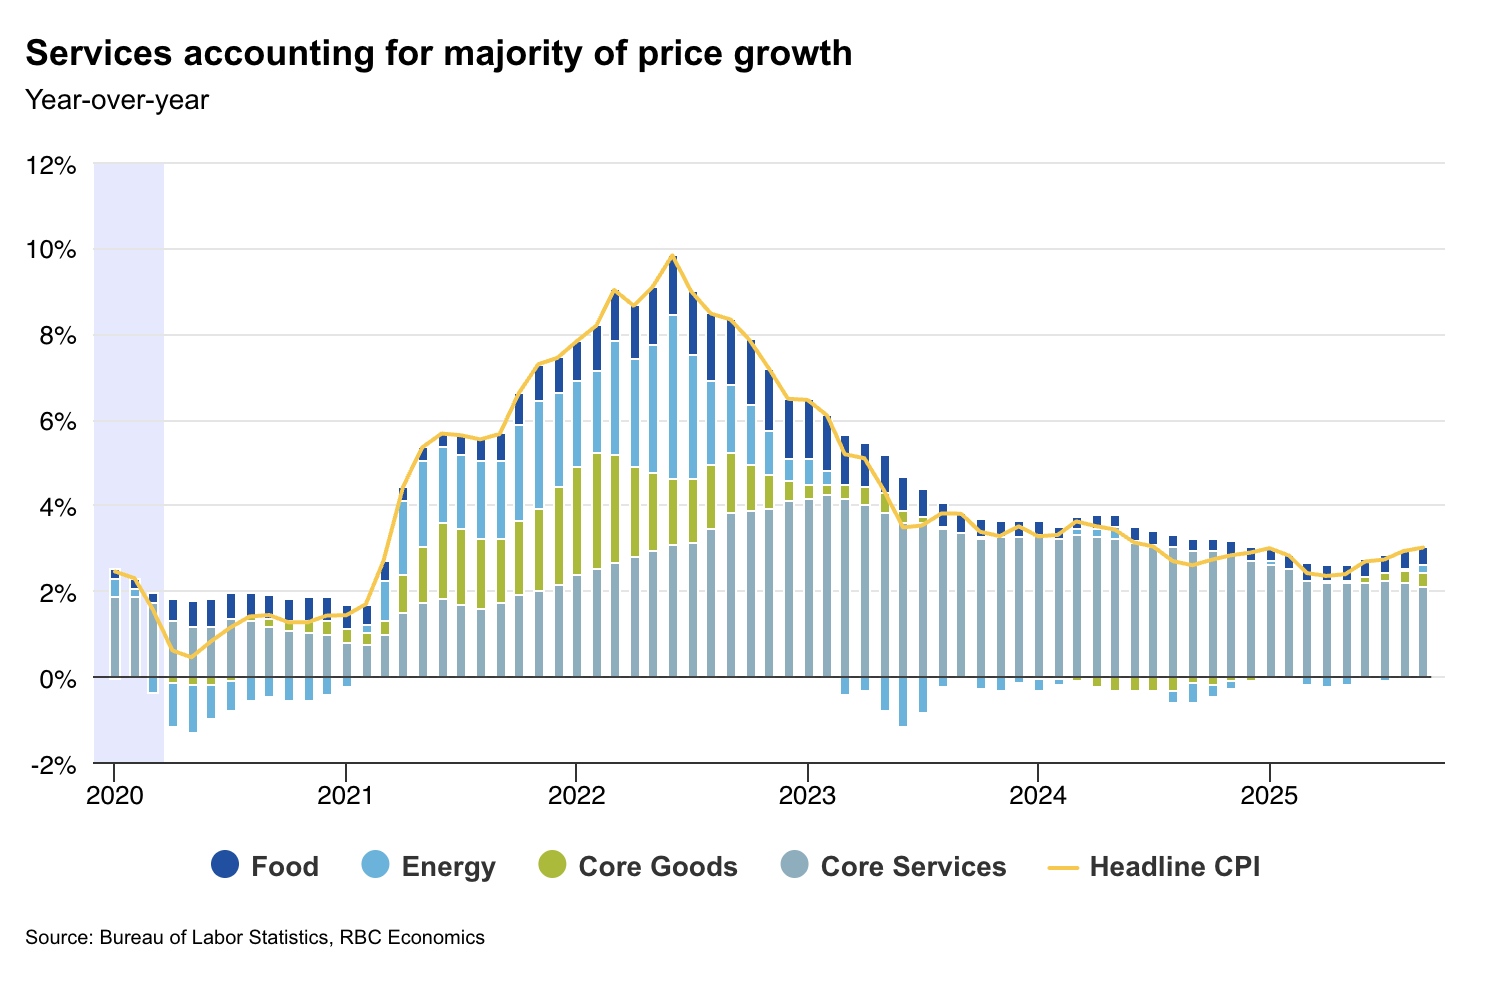
Stripping out core goods, core services inflation continues to run hot with the latest 2025 reading at 3.5% y/y. Housing plays a big part. We appreciate the nuances of owners’ equivalent rent of residences (OER)—notably that it’s lagged by nearly two years relative to real-time home prices. But it does not account for mortgage rate lock-ins, and is collected via a small survey unique to the Bureau of Labor Statistics (BLS). We still must acknowledge its importance, because of its massive weighting in the core consumer price index (CPI), comprising nearly one-third of the core basket.
That said, existing home sale prices bottomed just over two years ago in 2023. Since then, prices rose gradually throughout 2024. Keeping in mind what OER represents—a hypothetical measure of what homeowners would pay themselves to rent their own homes—this means it’s on a path to add upward pressure to core CPI. We aren’t suggesting another surge, like we saw in 2022, but we simply don’t expect OER to provide much help in moving inflation back towards the Federal Reserve’s 2% target in 2026. And, when you’re still 100 basis points away from that, the path of the largest CPI sector matters.
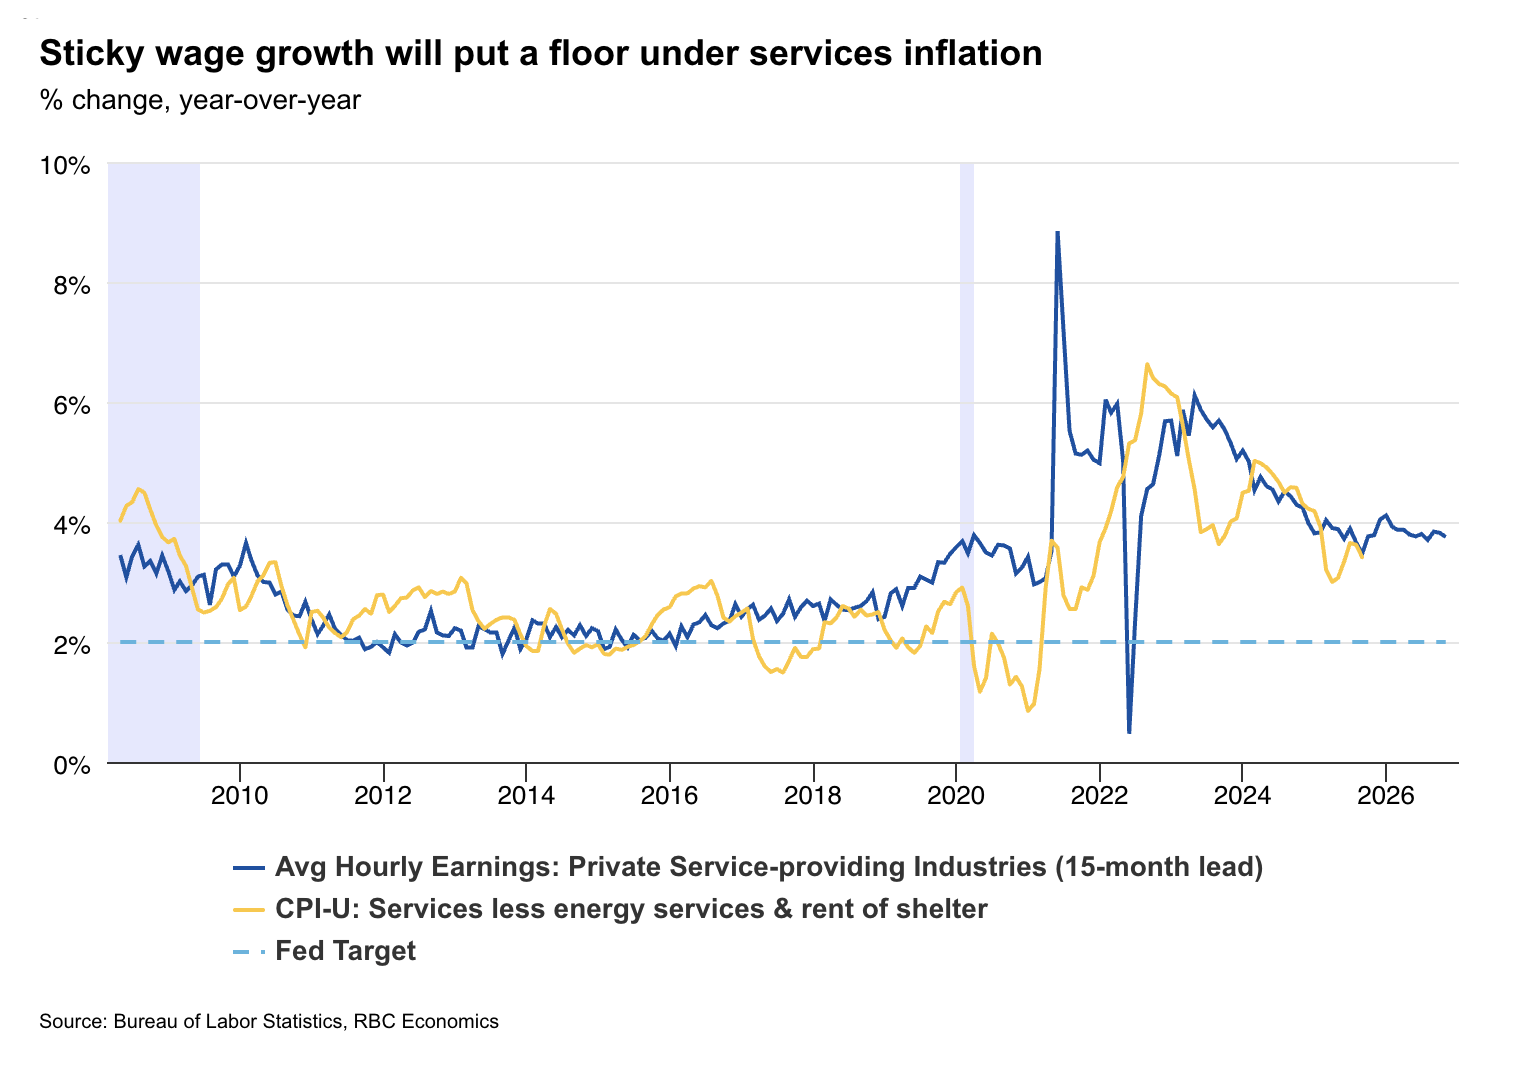
The other hurdle for inflation’s path back to 2% is core services ex-housing—a measure that’s never been negative on an annual basis in the last 40 years. Put simply, we just don’t expect deflationary pressure from this sector, and more importantly, expect limited disinflation. A large part of this sector is explained by wages—services are labor reliant after all. Given our tight outlook for the labor market (more below), we don’t see a path for wages, and therefore, core services ex-housing to move meaningfully lower.
With services poised to move sideways, the only sector left to provide deflationary help is core goods. We think that is unlikely for two reasons. First, core goods prices were already heading higher following a deflationary trend throughout most of 2024. As supply chains and demand normalized, there was a limited window for prices to fall meaningfully, and we had expected modest goods inflation in 2025 (i.e., below 1% y/y) before tariffs were introduced.
After adding tariffs to the mix, the contribution of core goods to core CPI added 0.3 percentage point to core CPI in Q3, well above the pre-COVID norm. Our concern remains that we have yet to see the full passthrough of tariffs to consumer goods prices, which we think will peak in Q2 2026.
Taken together, these sectors paint a picture of sticky inflation in 2026.
A ‘new’ US consumer is emerging
It should be well appreciated by now that the US consumer is becoming increasingly fragmented.
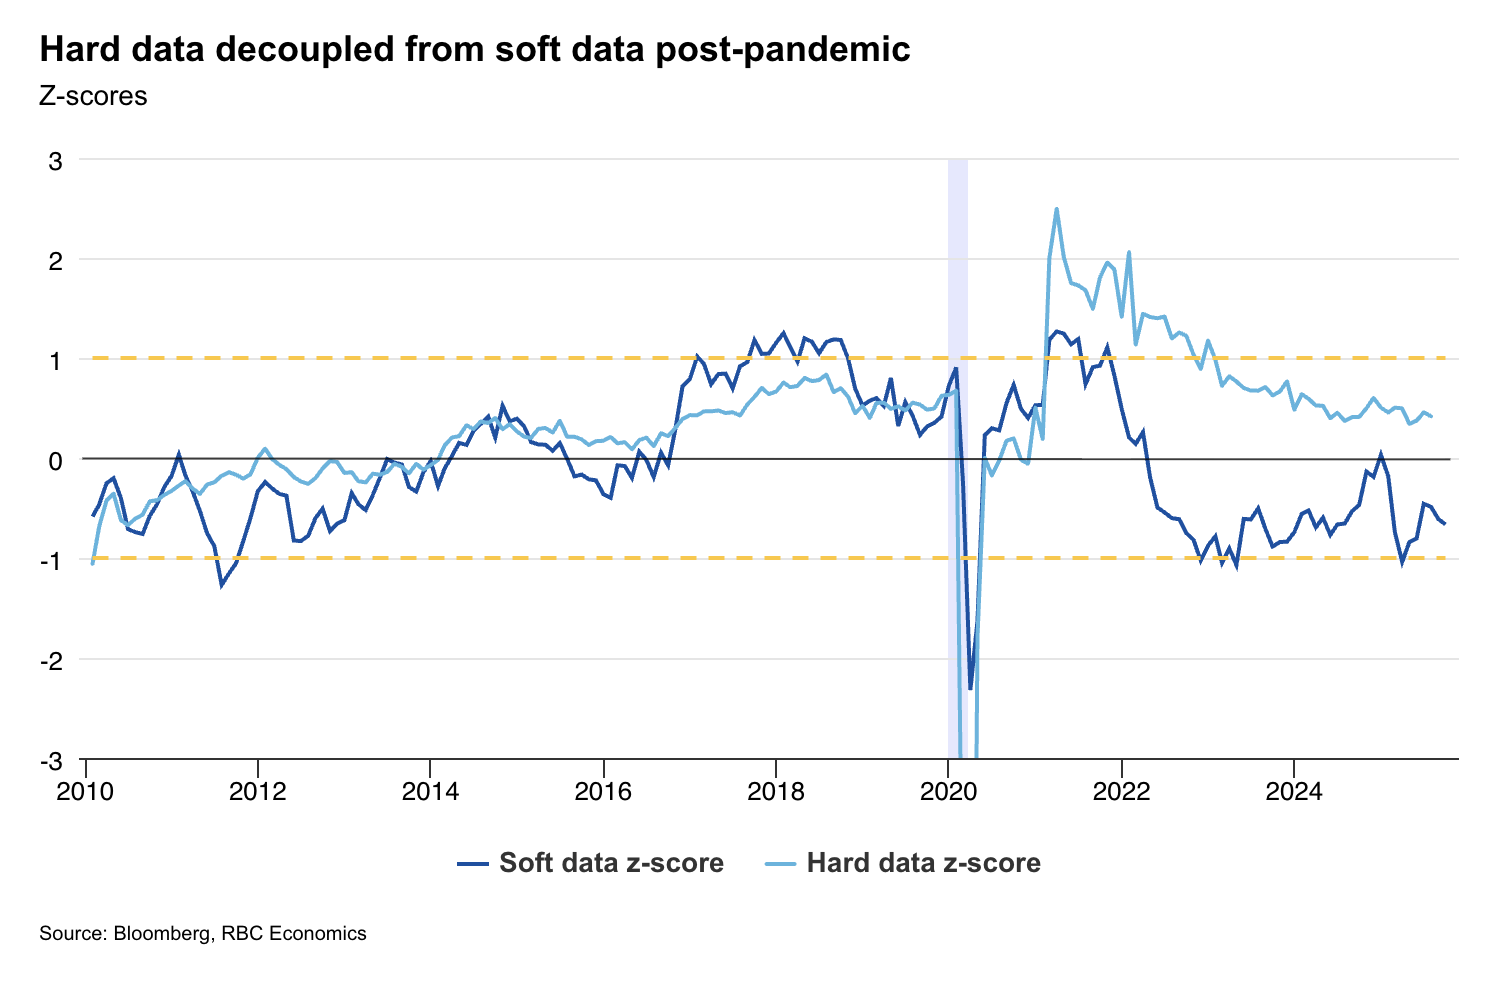
It’s a reality that is best exemplified by the divergence between soft data like consumer sentiment, which has been increasingly negative, and hard data that paints a picture of a resilient consumer. While both of these can be true at the same time, it means the weighting matters. In sentiment surveys, all households have an equal vote, suggesting most participants feel concerned about the economy. On the other hand, hard data is weighted by purchasing power (i.e., income), and the divergence suggests the top 10% of households are responsible for a near majority of consumer spending.
In 2026, we think the top 10% of income earners can keep the party going. We expect most households will feel marginally better off as disposable income gets a boost from favorable tax policies despite the rise in credit card and auto loan delinquencies, student loan repayments, and sticky inflation eroding real purchasing power. We see tax changes disproportionately benefiting upper income households, primarily through the increase of the state and local tax (SALT) cap deduction from $10,000 to $40,000.
The consumer backdrop looks slightly rosier for some groups. At the lower end of the income spectrum, most government transfer programs have benefited from high COLAs in recent years. Social Security is set to see a 2.7% increase in January due to high CPI readings in Q3.
It will be the middle-income households (20th to 80th percentiles) that will continue to feel the pinch of inflation. We wrote previously that these households feel the biggest impact of inflation on budgets and are least likely to benefit from the SALT cap in 2026. Still, with the persisting tight labor market we expect, this group should continue to spend so long as they have jobs.
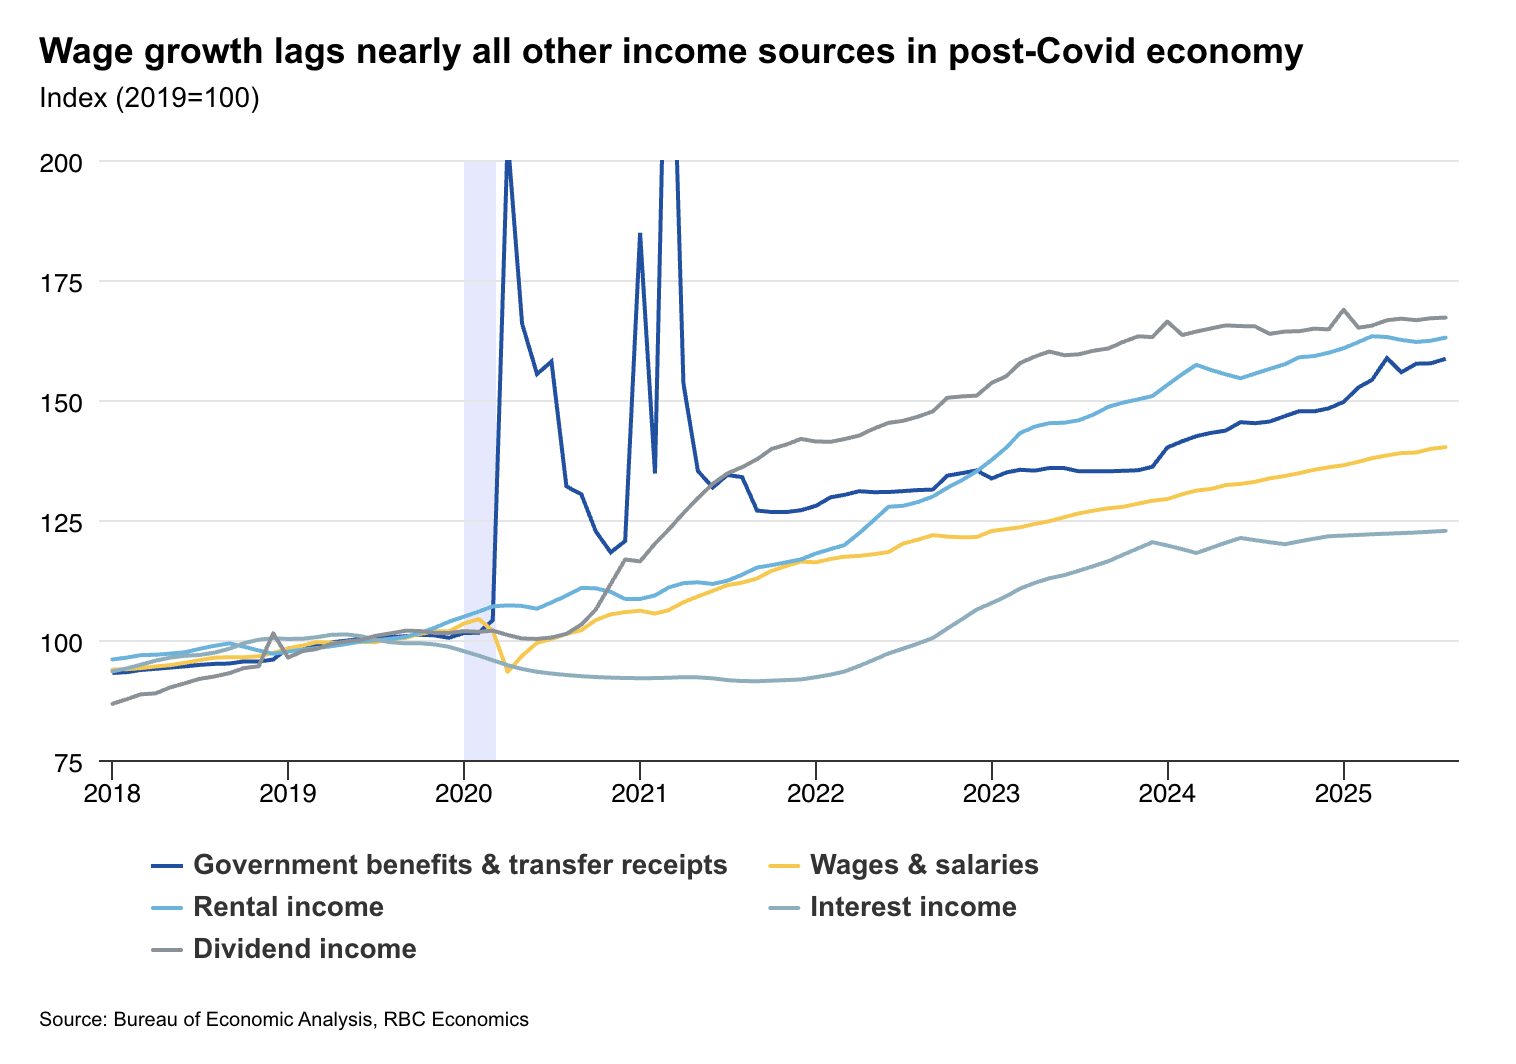
Importantly, the top 10% of income earners are the driving force of consumption as their incomes increasingly shift towards non-labor sources including dividends, interest, and rent. Income from dividends and rent have seen particularly robust growth in the post-pandemic economy, reflecting both an aging population shifting to a life phase less reliant on labor income (i.e., wages) as well as the strong growth in housing and stock markets—tailwinds for the wealth effect. There is also a notable overlap between higher income households, wealthy households, and age, meaning spending power is concentrated within a very specific cohort – the Baby Boomer generation. This cohort disproportionately drives expenditures across both essential services—including healthcare, legal, and financial services—and discretionary categories such as leisure and hospitality.
We acknowledge risks around our view—specifically Buy Now Pay Later (BNPL) programs, and a stock market correction. The former is relatively more benign. There isn’t a dataset that paints a clear picture of BNPL utilization, but we suspect the demographics most reliant on these types of programs are not in the upper income cohorts. Put another way, the risk is significant for lower income households, but less so for the broader consumer base.
Conversely, we view a stock market correction as a more significant risk because it relates to the wealth effect as well as the potential impact on labor markets. The more obvious impact of a correction is the negative wealth shock—high income consumers pull back on spending. But it could also send shockwaves through the labor market.
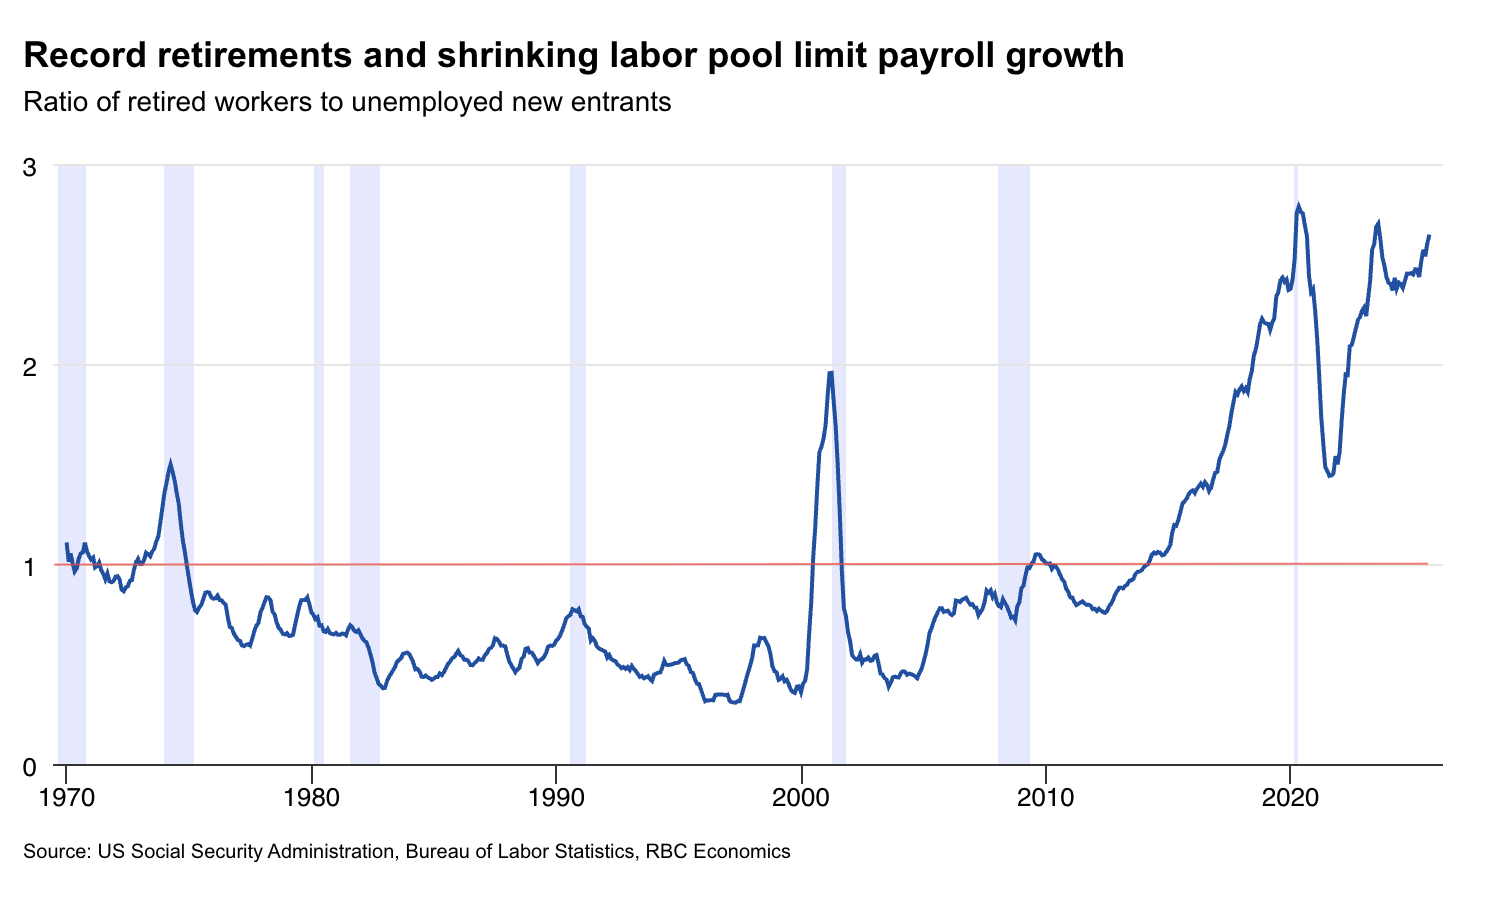
We are in the midst of peak Baby Boomer retirements, something not experienced in the US labor market before. This dynamic has helped to keep the unemployment rate low despite the slowdown in labor demand. If workers decide to delay retirement by a year or more due to a drop in the value of retirement portfolios, then we are likely to see upward pressure on the unemployment rate as new entrants are less likely to find work when replacement demand falls.
Labor market losing its edge as a leading indicator
The labor market has experienced a notable loosening over the past few years.
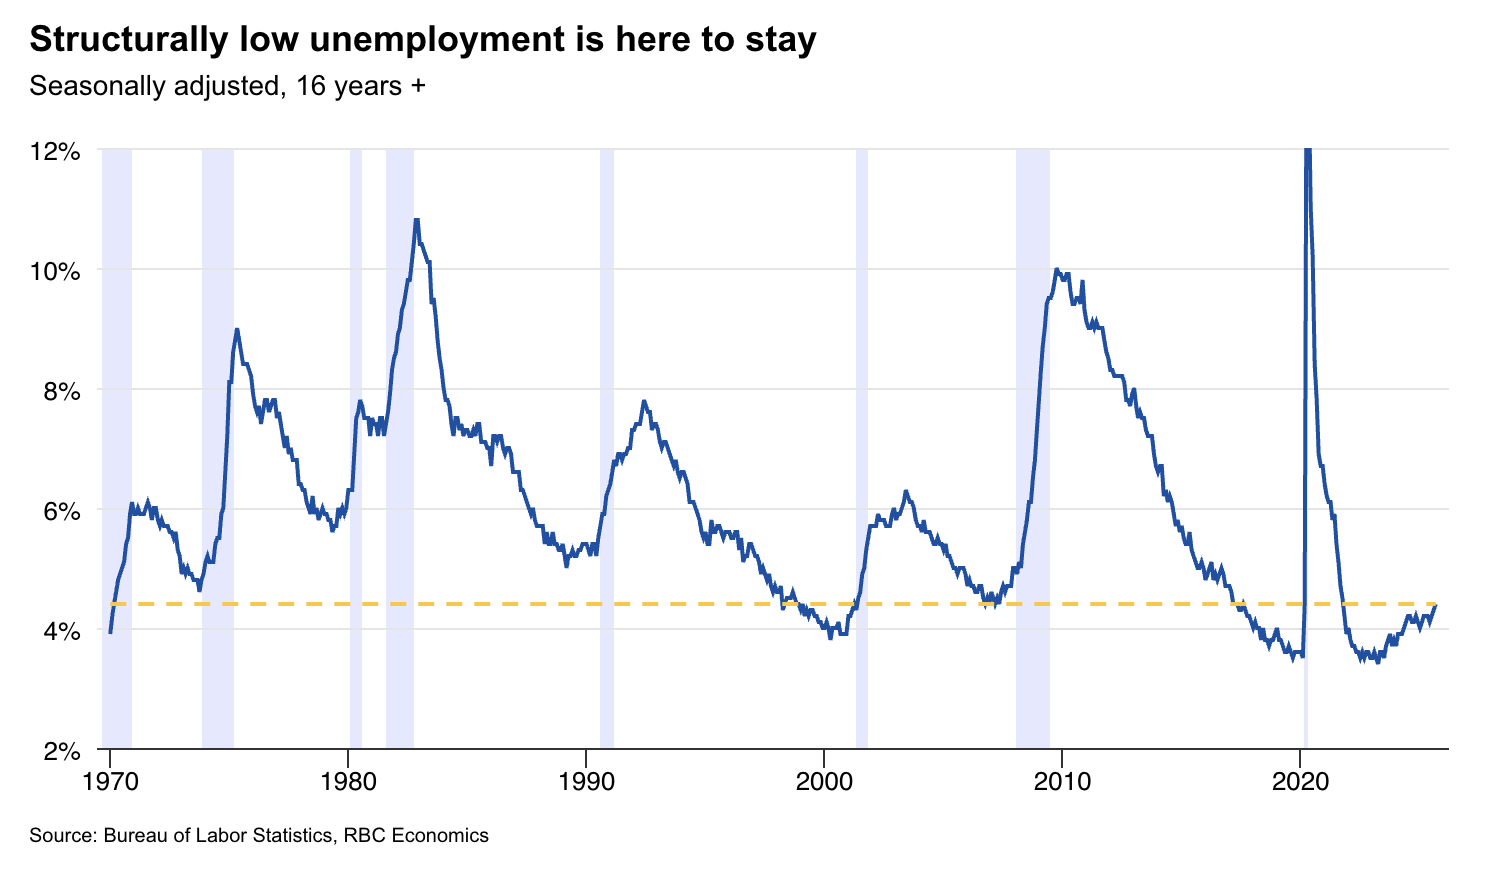
The unemployment rate is up 100 bps from the cycle low in 2022, and increasingly, we see signs of weakness in measures like hiring, job postings, and duration of unemployment. Still, with the unemployment rate at 4.4%, we would be hard pressed to describe this environment as weak. Going back to 1970, it has been lower for only two brief periods. That said, the direction of the labor market matters, and is being impacted by both supply and demand shifts in the current environment.
Overall, the demand (hiring) side is increasingly concentrated in just a few sectors. We’ve seen hard measures like payroll growth and job openings slow—reflecting hesitancy by businesses to hire during high uncertainty experienced earlier this year. In fact, payroll growth has been driven predominately by health care with few cyclical sectors showing signs of strength (with the exception of leisure and hospitality). As we discuss below in big government, the government sector is also contributing a sizable share of jobs this cycle, but we don’t necessarily view that as sustainable. Trade-reliant sectors including manufacturing, wholesale and retail, and transportation and warehousing have struggled, shedding jobs on net since Liberation Day.
At the same time, supply factors have fallen in tandem. Immigration policy has slowed the inflows of non-citizen workers in the labor force, and more significantly, retirements have picked up momentum in 2025. Taken together, we estimate these two factors removed nearly 3 million workers from the labor force since 2024. This supply-side shock has helped to keep the labor market tight and puts a ceiling on how high the unemployment rate can go. We think it plateaus at about 4.5% for most of 2026.
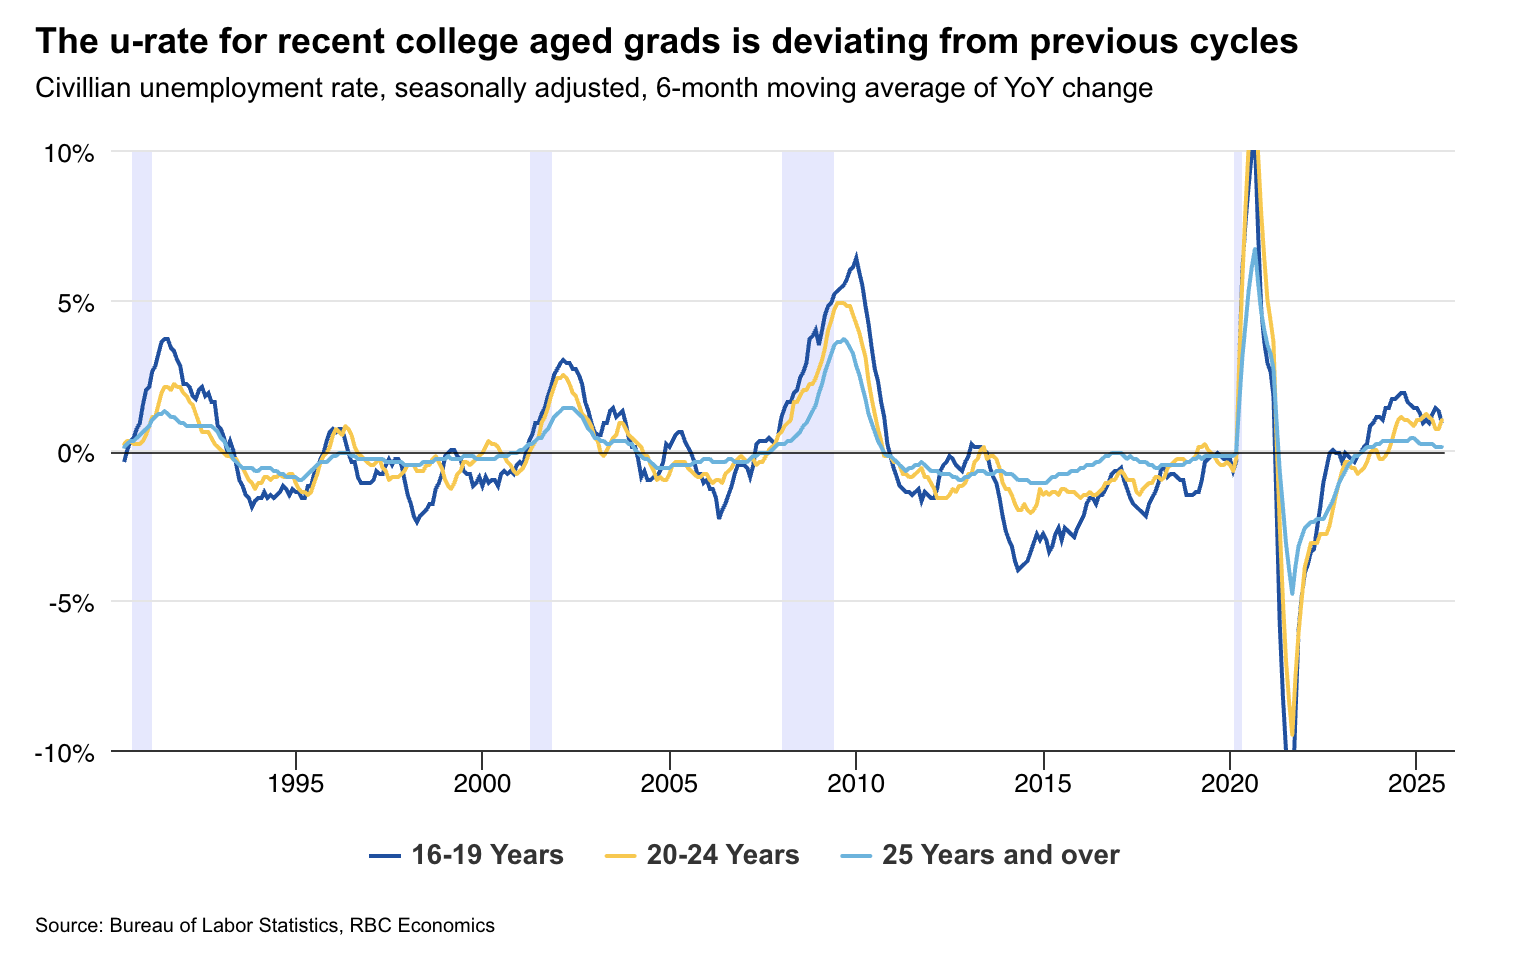
Some risks are emerging, notably from AI. We think it’s too early (more below) for AI to start replacing workers in a meaningful way in such a short period, and risks are premature in 2026. Still, we see signs of the recent college graduate cohort struggling to find work. Typically, 20–24-year-old workers fare better than teens when the labor market weakens. But this cycle is unique with the 20-24-year-old unemployment rate rising 1.2 ppts from a year ago (Q3 avg.) in contrast to teens seeing a more modest 0.4 ppt rise. The unemployment rate for prime age workers is unchanged from a year ago. While this could be a sign that AI capabilities are able to replace younger workers, we suspect uncertainty throughout 2025 contributed to this. Hiring plans were paused as companies tried to navigate tariff disruptions and a government shutdown.
Other risks more impactful in 2026 relate to supply. First, any additional changes to immigration policy could limit non-citizen workers. Specifically, H-1B visas are a small, but important, source of labor in the US. With a growing focus on this group, the current administration may reduce inflows of those skilled workers, further reducing supply. Conversely, as noted above, a decision by older workers to delay retirement would result in a drop in replacement demand, and limit job openings for those currently looking for work.
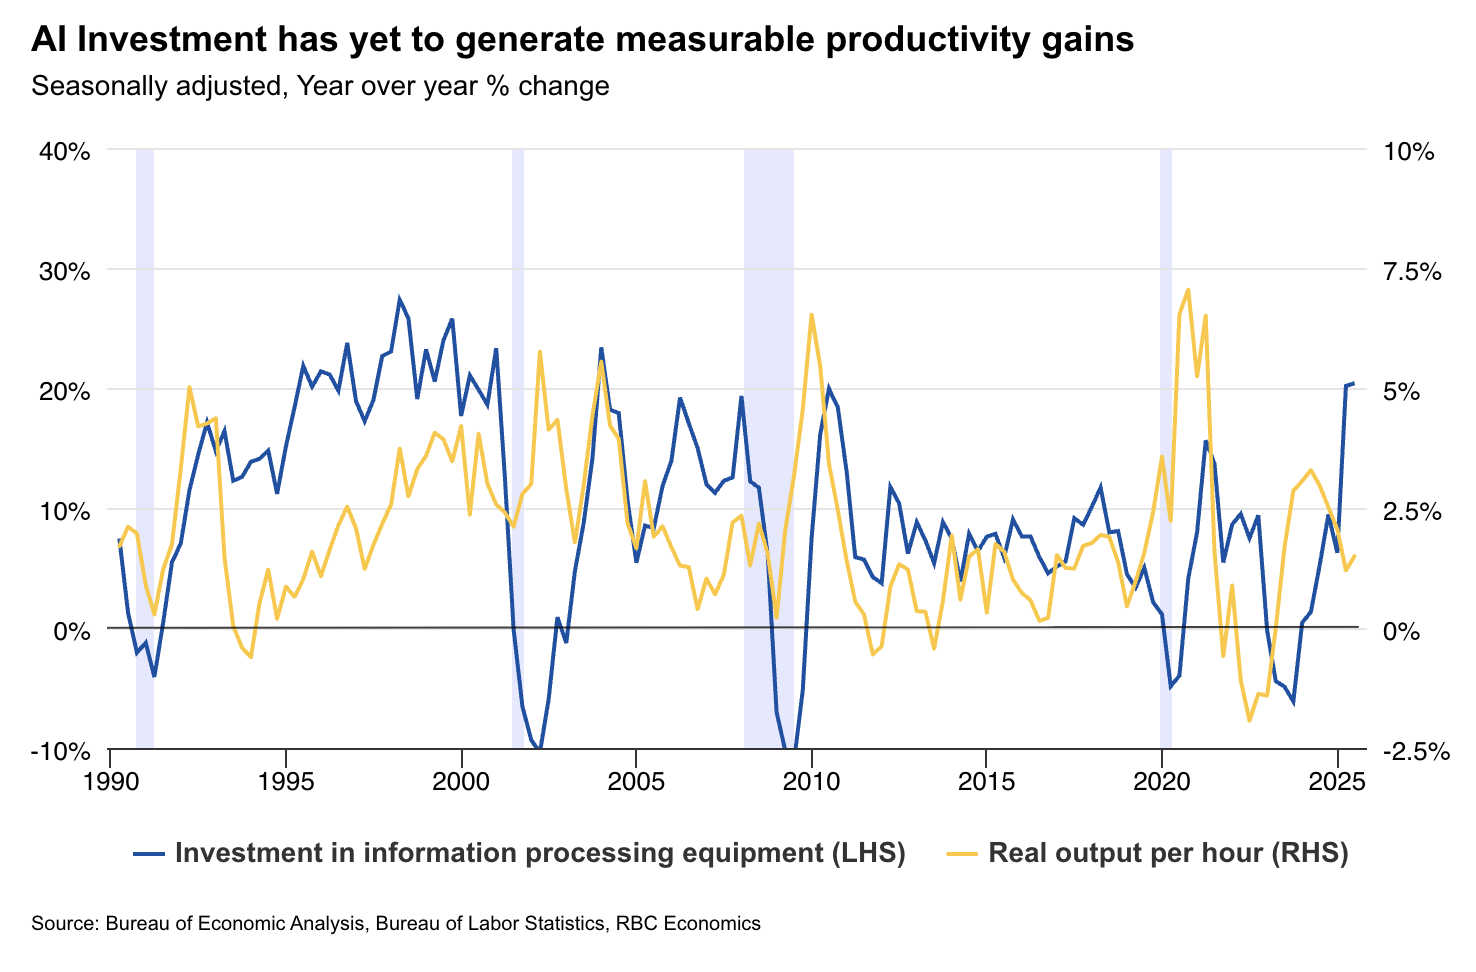
AI driving growth, not productivity yet
The past few years have seen a boom in AI investment brought on, in part, by a generous CHIPS Act that provided nearly $53 billion of support for the US semiconductor sector.
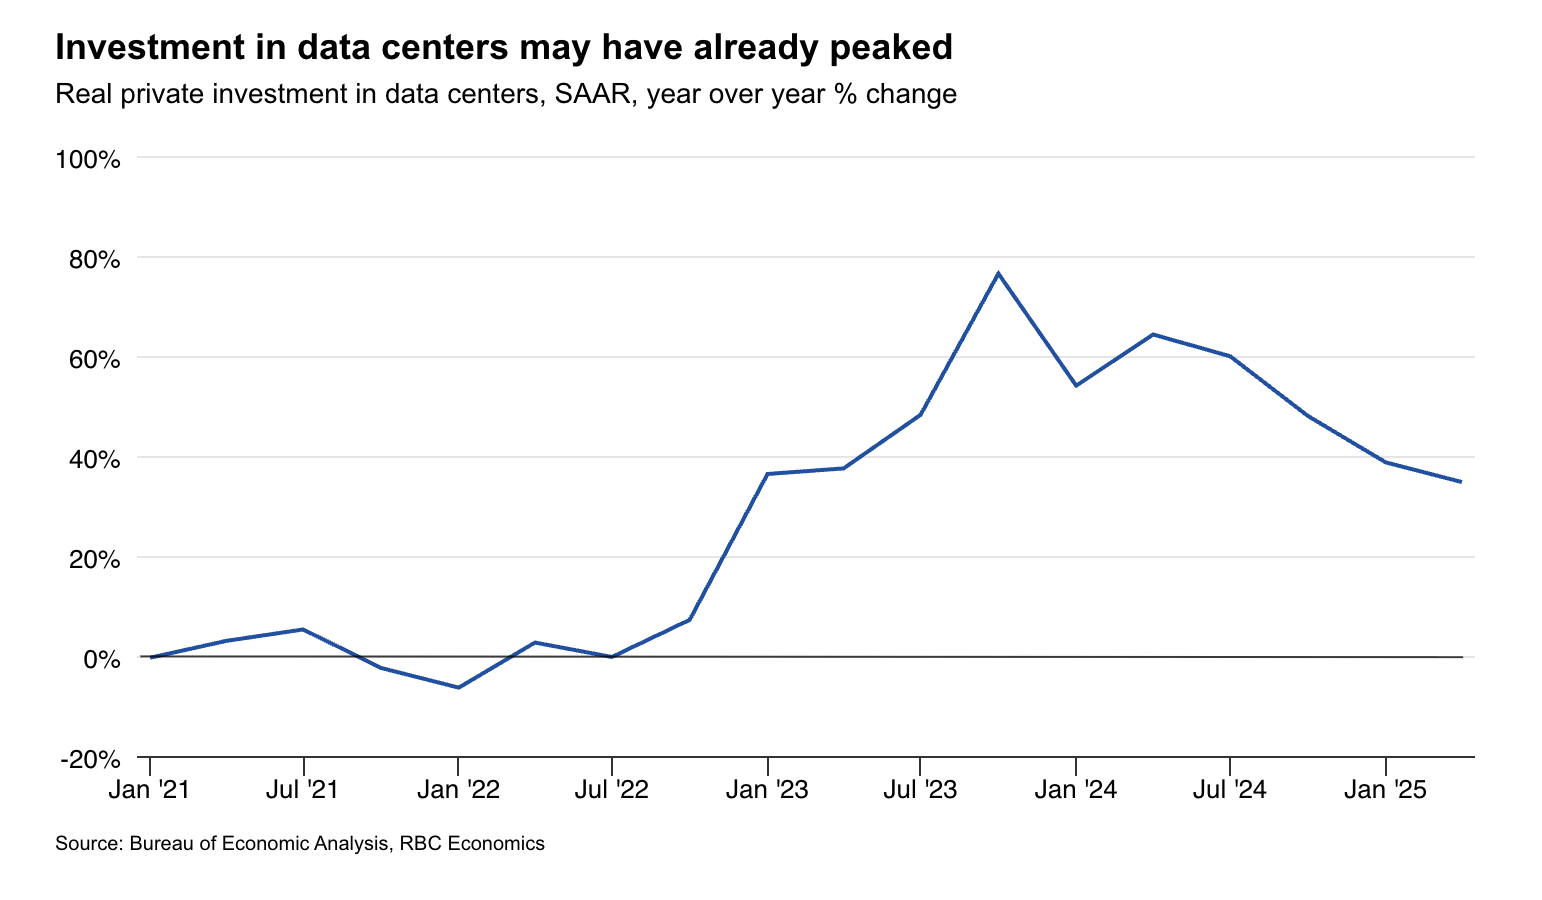
This investment helped boost manufacturing capacity in the US as well as R&D activity—and the results are impressive. Since 2021, data center investment has more than doubled, adding critical computing capacity. In fact, data center investment accounted for nearly 25% of total investments in all US structures in 2024. It has been a growth driver, contributing as much to GDP growth as consumption in recent quarters.
However, we think some are conflating the economic forces of growth with productivity. The AI boom has so far been purely an investment in infrastructure that is boosting current growth. In fact, we don’t see any signs of a significant productivity boom yet—the true dividend that will determine the return on investment.
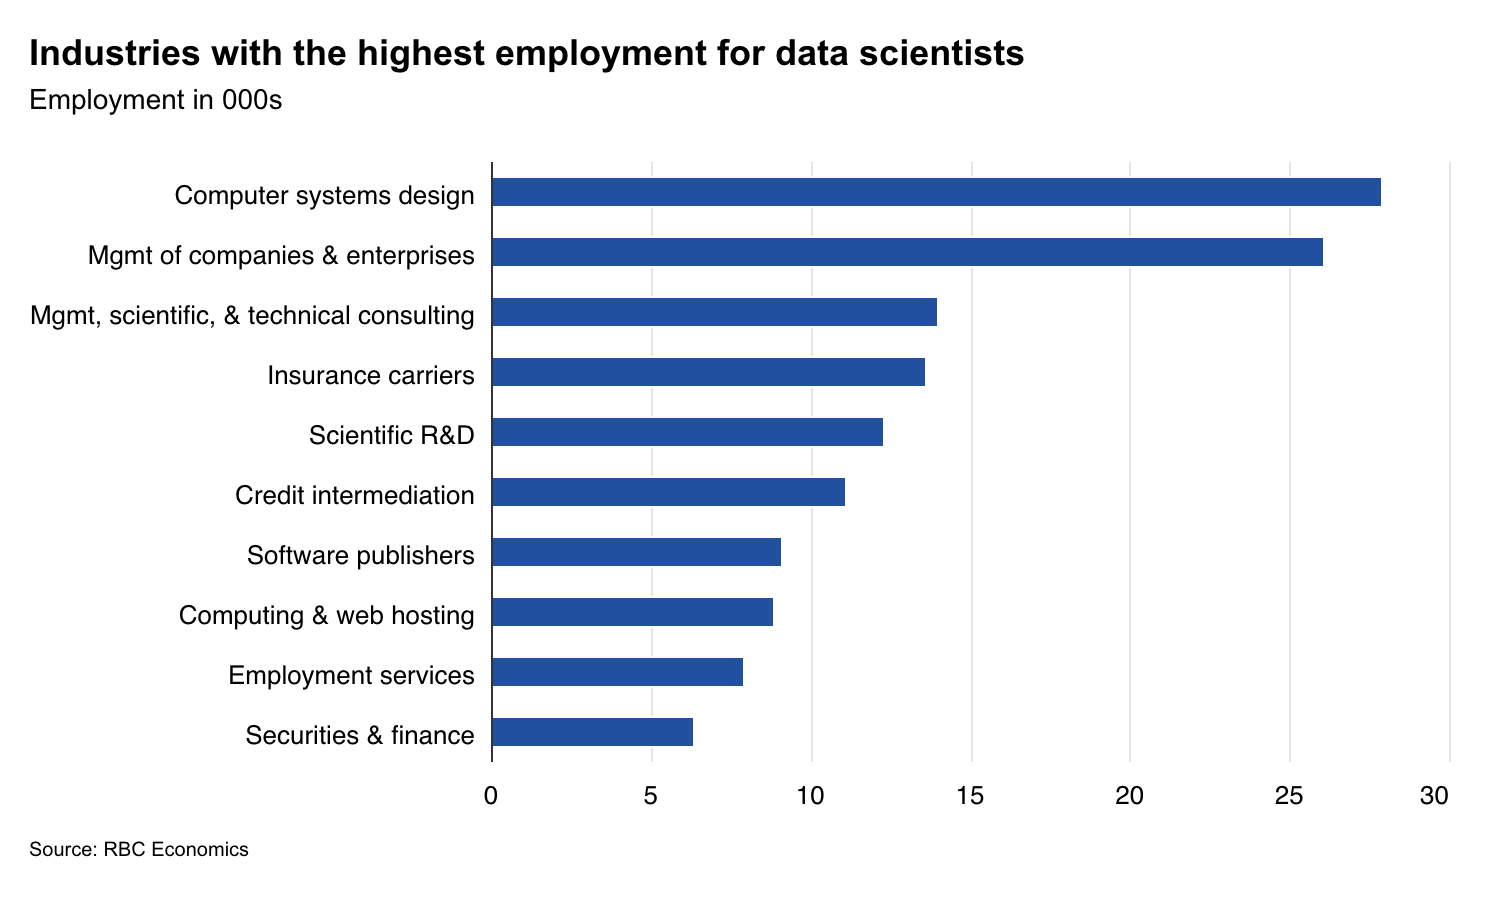
We believe the labor market needs to equip workers with the right skillsets to fully utilize AI, and meaningfully change how work is done. Cue the rise of the data scientist. Data science jobs are growing quickly but are relatively new. Latest BLS data suggests there are about 233,000 workers employed as data scientists in the US. And their distribution is not equal across geographies or industries.
Critical to the productivity story will be how companies and sectors utilize AI and incorporate it into their production processes. Currently, the sectors employing the largest number of data scientists are concentrated in tech, finance, and health, suggesting early beneficiaries will be in the services space. To that end, we see limited upside to the goods-providing sectors where manual labor still dominates workflows.
Big government puts a floor and ceiling on growth
By almost every measure, US federal government deficit spending is running near all-time highs.
Naturally, this has raised concerns about the sustainability of government spending and Washington’s ability to pay debts. At the same time, big government is likely muting the economic cycle on both the downside and upside. Like guardrails on an economy, the sheer magnitude of government spending—we estimate the deficit around 6% of GDP—limits how weak the economy can become in aggregate. And, since public sector spending tends to be less efficient with lower productivity, a growing government may be putting a ceiling on growth over the medium term as well.
The attention might be predominantly on government spending, but the requirements are also rising as the population ages, putting additional pressures on social security, Medicare expenses, and the labor market. Health care and social assistance as well as government jobs now make up one in three jobs in the US. Looking ahead, 2027 will see larger cuts to government spending, but for now, 2026 is likely to benefit from that spending.
This article is intended as general information only and is not to be relied upon as constituting legal, financial or other professional advice. The reader is solely liable for any use of the information contained in this document and Royal Bank of Canada (“RBC”) nor any of its affiliates nor any of their respective directors, officers, employees or agents shall be held responsible for any direct or indirect damages arising from the use of this document by the reader. A professional advisor should be consulted regarding your specific situation. Information presented is believed to be factual and up-to-date but we do not guarantee its accuracy and it should not be regarded as a complete analysis of the subjects discussed. All expressions of opinion reflect the judgment of the authors as of the date of publication and are subject to change. No endorsement of any third parties or their advice, opinions, information, products or services is expressly given or implied by Royal Bank of Canada or any of its affiliates.
This document may contain forward-looking statements within the meaning of certain securities laws, which are subject to RBC’s caution regarding forward-looking statements. ESG (including climate) metrics, data and other information contained on this website are or may be based on assumptions, estimates and judgements. For cautionary statements relating to the information on this website, refer to the “Caution regarding forward-looking statements” and the “Important notice regarding this document” sections in our latest climate report or sustainability report, available at: https://www.rbc.com/community-social-impact/reporting-performance/index.html. Except as required by law, none of RBC nor any of its affiliates undertake to update any information in this document.