"Fall forward. Here's what I mean: Reggie Jackson struck out 2,600 times in his career - the most in the history of baseball. But you don't hear about the strikeouts. People remember the home runs. Fall forward. Thomas Edison conducted 1,000 failed experiments. Did you know that? I didn't either - because number 1,001 was the light bulb. Fall forward. Every failed experiment is one step closer to success." - Denzel Washington
Note that the contents of this memo are all my thoughts, and not the views of RBC Dominion Securities. As well, no part of this content was AI-assisted or created.
Friends & Partners,
Following my Partner Note from last month and considering the wonderful quote above, the theme in markets remains much the same – history may not repeat, but it tends to rhyme. And things are getting a little frothy out there.
Nvidia is all the rage, and blowout earnings from them carried the S&P 500 to another all-time high – here are some prescient and timely words from Warren Buffett’s annual letter just released: “Within capitalism, some businesses will flourish for a very long time while others will prove to be sinkholes. It’s harder than you would think to predict which will be the winners and losers. And those who tell you they know the answer are usually either self-delusional or snake-oil salesmen. For whatever reasons, markets now exhibit far more casino-like behavior than they did when I was young. The casino now resides in many homes and daily tempts the occupants.” Berkshire is now sitting on record levels of cash (over $160 billion).
All-time highs are actually quite common so that part shouldn’t worry us necessarily. As we consider the relentless rally and current valuations of stocks, the reality is that the market is passing what one would consider a “Goldilocks” environment and is now entering another realm of justification – something referred to as “Platinumlocks” (a step above Goldilocks).
And, frankly, a new justification and fancy nickname for this market is becoming necessary if we look at valuation, sentiment and what’s priced in. Starting with valuation, the S&P 500 is now trading at 21x 2024 S&P 500 earnings-per-share of $243/share. A 21x multiple isn’t just high by historical standards, it’s largely unheard of unless there’s ongoing Quantitative Easing (QE) by Central Banks and 0% interest rates. Only then has a 21X multiple been sustainable for any decent period of time and right now, we have the opposite of QE and 0% rates, as Quantitative Tightening is ongoing while rates sit at multi-decade highs! Nonetheless, we are here and this is beyond ‘Goldilocks’ (which could be argued for 19x-20x).
And that’s largely confirmed by the fact that despite several pieces of negative news over the past few weeks, including 1) a rebound in important inflation metrics, 2) the Fed pushing rate cut expectations out to June from March and the total number of rate cuts for 2024 from 5 or 6 to 3 or 4, and 3) some soft consumer spending data via Retail Sales and corporate commentary. Despite all of this, market sentiment has barely taken a dent and rages on with bullish indicators virtually peaking, reflecting the fact that investors believe a ‘Platinumlocks’ environment can continue and propel stocks higher.
Investors are extremely bullish about the outlook and not overly concerned about risks, as evidenced by very high readings in the CNN Fear/Greed Index, AAII Investor Sentiment Survey, and Investors Intelligence Advisor Sentiment Survey.
Consensus Inc bullish sentiment is at a 20-year high for stocks:
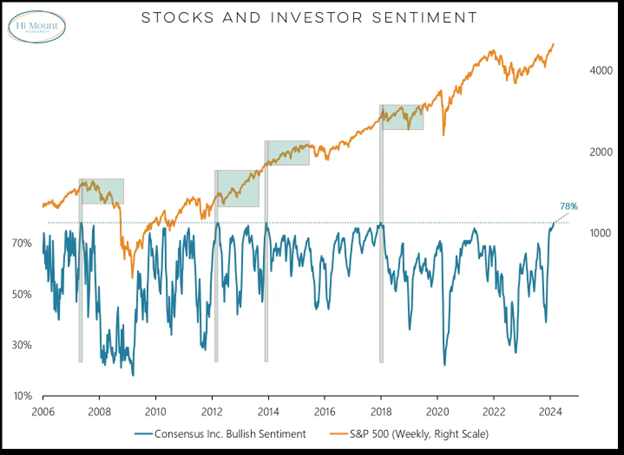
At the risk of sounding like a grizzled old skeptic, never-ending investor optimism towards this market, as it surges past reasonable valuation level after level, does make me increasingly more nervous about volatility and ‘air pockets’ in the market. To put things simply, I do not agree that the current environment, with a 5.3% fed funds rate (and no rate cuts coming in the near term), core inflation above 3%, economic growth solid but showing signs of slowing, commercial real estate risks and two major global conflicts that have the potential to turn into regional conflicts, is one of the “best” market environments I have seen in my career and warrants one of the highest multiple I’ve seen in my career.
I’m not saying extreme valuations or bullish investor sentiment will end this rally in the near term – things can go on a long time in markets, positive or negative. In today’s case, there has to be a negative event that occurs to change things, and so far, that event hasn’t appeared. What I am saying is that this is literally a market that’s starting to invent new words for how great US stocks are performing and how amazing stocks imply the current environment is for corporate profits. So I am becoming concerned that what stocks are saying via their performance is detracting from the reality on the ground for companies.
To top all this off, we seem to be at the point in the cycle where the bears are being ridiculed, things that tend to happen late in the cycle. If you’re not bullish you’re cast aside – that’s certainly a red flag. I have seen the complete opposite environment too, not that long ago.
Maybe taking a step back and remember Warren Buffet’s quote “be fearful when others are greedy, and greedy when others are fearful”. Perhaps one should consider positioning accordingly. The risk-reward always has to be considered for every single decision in life, especially so in portfolio positioning, and today’s facts imply that we should be focused on limiting downside exposure, not reaching for upside in a market that’s trading at unsustainable valuations and has priced in essentially a financial version of Nirvana (low inflation, dovish Fed, solid growth, resilient earnings and no negative surprises). I suppose that can happen, but in my 25 years in this business, I haven’t seen it yet.
There are some wonderful investing opportunities and strategies out there, but we’re in a different environment than we were in the last decade or more, so we have to adjust accordingly.
Some Other Interesting Things to Highlight + Events
International Women’s Day is coming up in March, and the theme for this year is ‘inspire inclusion’. It is a day for everyone to reflect on progress made to date towards equality, to celebrate acts of courage and determination by women around the world and to highlight actions we can all take to reinforce our commitment to advance the representation of women. I am honoured and inspired to count a number of influential and accomplished women leaders at various ages and stages of their lives and careers as clients of my practice.
On this note, I will be hosting Olympic Bronze Medalist Marion Thenault to speak at Beaver Valley Ski Club on March 2nd (Silver Creek Room, 4:30 pm) which should be interesting and enlightening! Marion is an exceptional person and has gone through a number of pivots and transformations over her career, an experience that landed her on an Olympic podium in a sport she didn’t originally know existed.

How’s Your Portfolio? You: “Strong to Quite Strong – I Think…”*
Is this you? One of the best clips of comedy gold. It is awkward but relevant!
The most popular way of investing in stocks by most investors (and Advisors!) is by indexing, or in the case of most Advisors – closet indexing (this means that they're usually just tracking the main stock and bond indices). Don't get me wrong – this isn't a bad strategy for many, and it should come at a low cost. But most Advisors aren't charging a ‘low cost', so are you getting real value in your portfolio management?
The typical portfolio has an allocation towards equities, and a healthy allocation towards bonds. The bonds are there to act as a ‘ballast’ to the portfolio, and offset equities when they hit inevitable speedbumps. That means, they’re supposed to be negatively correlated (stocks go down, and bonds are supposed to go up).
Well, that ain’t the case recently.
One of the major developments for portfolio construction over the past two years is the abrupt change in the relationship between equities and bonds. After two decades of mostly negative correlation between equity-bond returns—prices moving oppositely to one another—the rolling 36-months correlation between monthly returns on the S&P 500 and Treasuries turned positive in August 2022 and has stayed there since.
On top of this, most investors just buy an index (like the S&P 500) for the equity exposures. Indexing is a strategy that can work well, particularly in winner-take-all trending market regimes (i.e. recently as we've experienced the rise and rise of the big US tech names), as it skews investors into the bigger and winningest sectors and stocks and out of the losing ones for that period.
But there's a hidden cost – and this is in the form of creeping, quiet, additional risk. See the chart below.
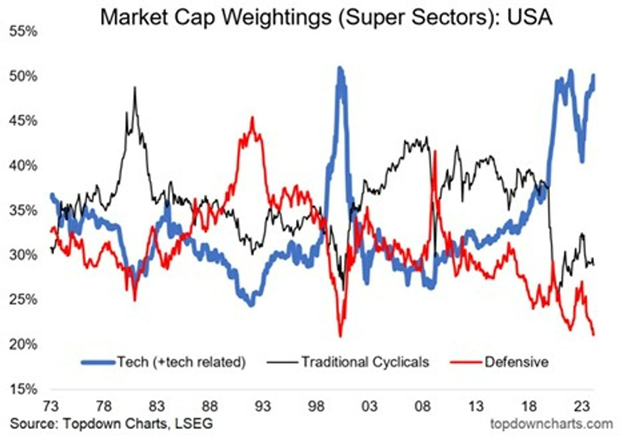
Index investors in a typical market-cap weighted US equity index now have almost a 50% exposure to tech and tech related sectors! And if you own a global index, note that the US equity market now carries about a 70% weight in the MSCI World Index. So, if you buy a a global equity ETF, it's largely just the S&P 500 plus some odds and sods.
So far so good as the US market has crushed it of late, but look at history. The cost of this is that the index has become far less defensive than usual (and currently exhibits a record low cap weighting to utilities, consumer staples, healthcare which are typically defensive sectors).
So, today, the index investor is more exposed to downside in tech stocks given the inherent weighting they have to that sector, exacerbated by the smaller weighting to defensive sectors (which should exhibit much less downside during any downturn – hence the term ‘defensive').
On top of this, there is a much smaller weighting than usual to traditional cyclical sectors such as energy, materials, industrials, and financials, which means the US index may gain less in a more traditional ‘goods and activity' economic upturn.
So, we have a problem – indexing has you way too concentrated, and bonds aren’t going to save the day if things get rocky out there. There are alternatives and ways to address these risks, which takes an institutional approach to portfolio construction. This is where I come in.
More Reason For Caution*
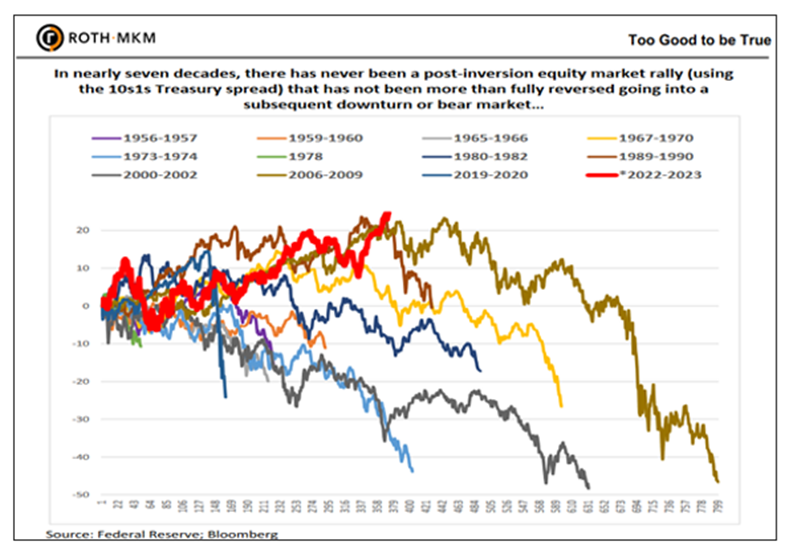
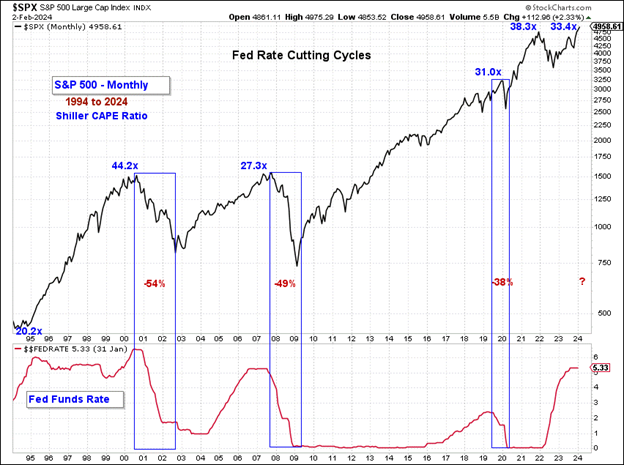
Stocks could certainly continue higher driven by the current AI “frenzy”, but risks are growing similar to what we saw in 1999 and 2007, both times preceding major market pullbacks. The chart below shows that 100% of the time going back to the 1950s, post-yield-curve-inversion-rallies have been entirely retraced. This means that if we don’t see the lows in the markets set in October 2022 revisited in the coming quarters or years, it will be the first time in history. That’s a bit of scary statistic.
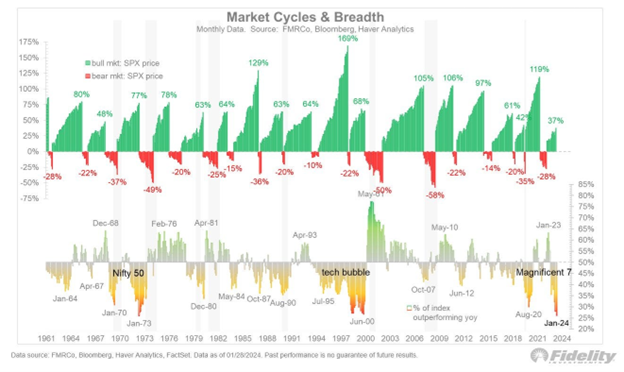
As many know, the big US tech names continue to pull the market higher – this speaks to market ‘breadth’ (the number of companies moving stocks up or down). Breadth continues to be crappy. We are living in one of the ‘narrowest’ markets in history, with only 26% of stocks outperforming the overall index. This is reminiscent of markets in 1998-2000 and 1970-73. In 2000, markets cratered 53%, leaving many in tears. The early 1970’s marked a decline in valuation, as the P/E ratio went down from 20x to 7x, causing substantial destruction of value as well.
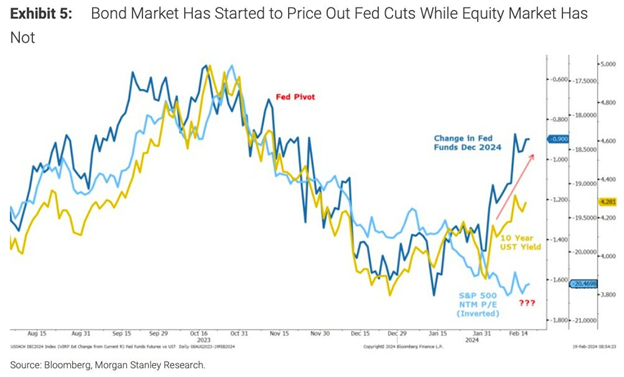
Interestingly, because of the current dynamics in the stock market, equities haven’t priced in interest rate cuts while bond markets have. Many say that are the ‘smart money’…
In the current environment with interest rates having risen so far so rapidly, there have been few stresses in the system that have surface – so far. But if ‘higher for longer’ rates becomes a reality, which seems to be slowly setting in, there is a risk something will blow up. Regional banks were the first shoe to drop last spring but the issue was largely contained. The next issue they will have to navigate is the commercial real estate exposure on their books. We may see more noise on this front coming soon to a theatre near you:
Many point to the cash buildup ‘on the sidelines’ (in money market accounts) as a potential backstop to the current market, currently sitting at ~US$6 trillion:
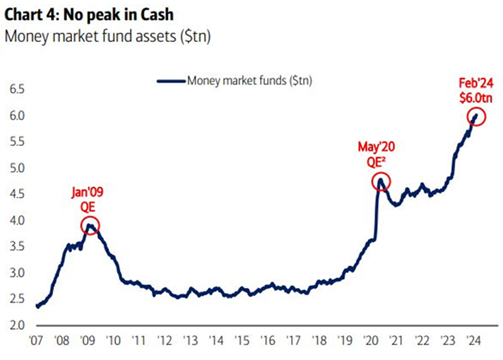
Source: BofA
But if we dig in and look at the relationship between household cash levels and equities, there’s no supporting evidence that this is bullish. Based on quarterly data since 1985, the data shows that there is essentially no relationship between the quarter-over-quarter change in the S&P 500 and the three major categories of household cash and cash-like holdings.
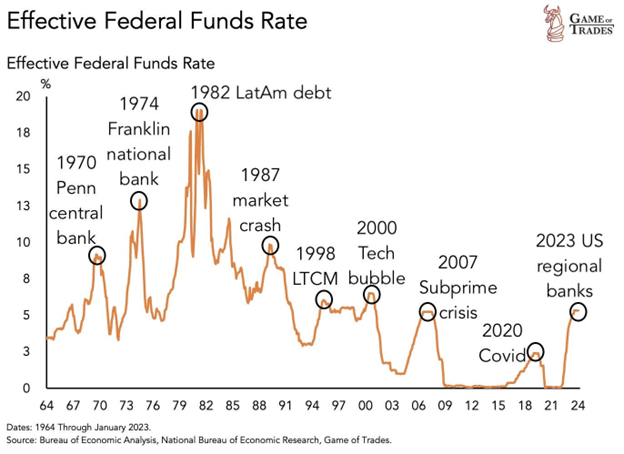
And finally, this chart speaks for itself, and should urge some caution:
But Lots of Reason For Optimism*
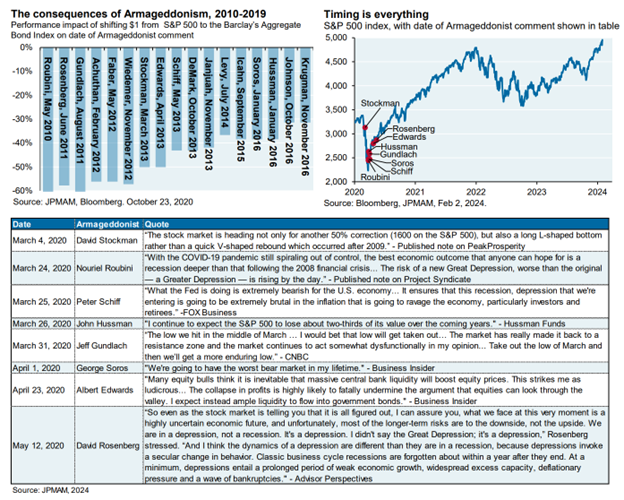
Even though we’re a bit frothy currently, the outlook longer-term remains solid. And, remember, markets go up over time, so taking a fundamental bearish view and position rarely pays over time. The naysayers often get taken to the woodshed:
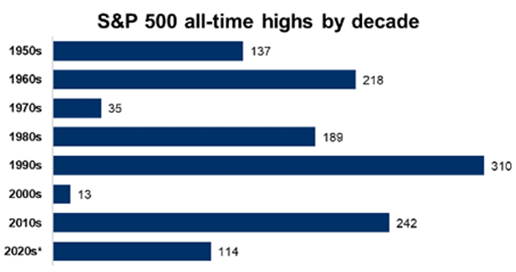
We are at all time highs, but that doesn’t mean much necessarily – it’s important to recognize how common all-time highs are. Since 1950 the S&P 500 has established 1,258 all-time highs along the path to its current level. That’s an average of over 17 every year. New highs are a normal part of equity markets. Often they have to do with continued growth of the economy and corporate profits.
Source: RBC GAM
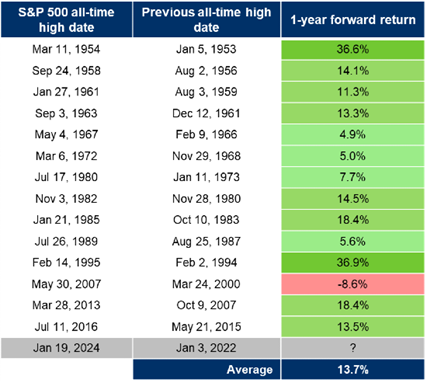
We have just recently been through a 2-year stretch where the S&P 500 didn’t reach an all-time high. With this in mind, the below shows what has historically happened to the U.S. equity index in the year following a new high when it has gone at least a year without one. Prior to January 2024, there had been 14 cases since 1950 where the S&P 500 reached a new all-time high after going at least one year without one. Over the following year the index was higher 13 out of 14 times, and on average was up 13.7%.
Source: Bloomberg and RBC GAM
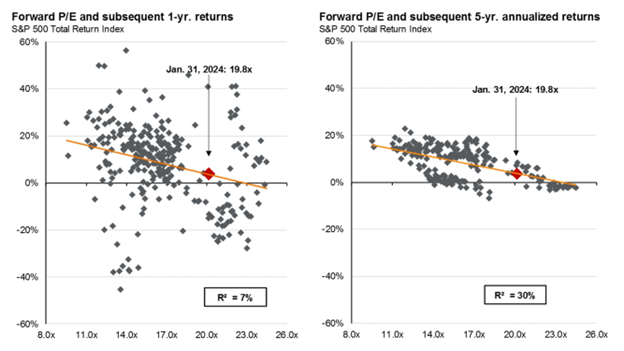
Valuations may be high in the US (not so much in Canada and internationally), but remember that valuations don’t tend to mean much over the short term. They do correlate with returns over longer time horizons:
Source: Morgan Stanley
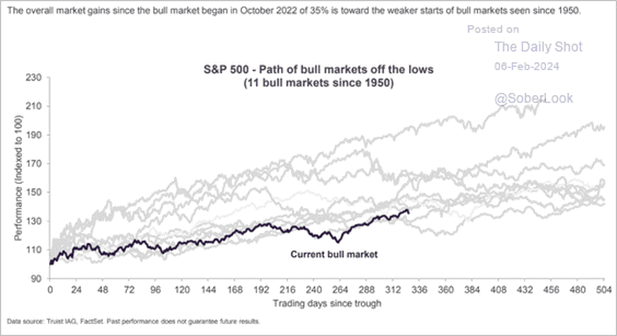
In a historical context, the current bull market has shown relatively modest strength, and still could move a lot higher:
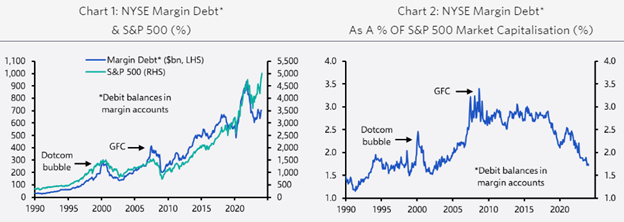
Finally, there are no obvious signs of high and rising leverage in the equity markets, which is typical before crashes historically. This is typically seen in the amount of margin debt outstanding by investors. This is because they get very speculative and borrow money to buy stocks. Although the ratio had risen a bit recently, it hadn’t done so like it did before the Great Crash of 1929, the bursting of the dot com bubble, or the Global Financial Crisis. Margin debt has actually been falling recently (see left chart). And the ratio of margin debt to the size of the stock market has been doing likewise (see right chart).
Source: BNP
Is the Consumer in Trouble?*
That depends – what is the health of the average consumer in Canada or the US?
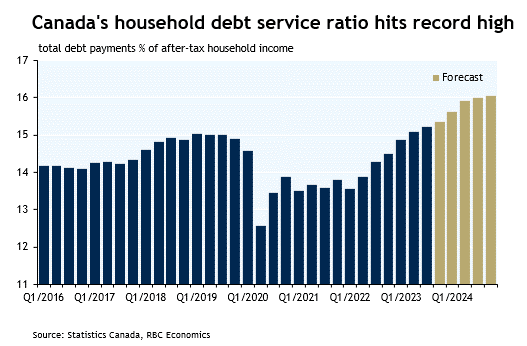
Well, Canadians are pretty indebted as we know. Canada’s debt servicing ratio hit a new record in recently as past interest rate increases continue to pass through to household mortgage payments (with a lag). Debt servicing costs will continue to rise with a wave of mortgage renewals still to come. The Canadian economy has also contracted for five straight quarters on a per-capita basis with consumer spending softening. Many are praying for rate cuts to come soon – we will see when that happens (there are some whispers out there that rates could increase!).
The story is a bit different in the US. Higher rates have not had a real impact on consumer – why is that? Apollo notes that almost 90% of US household debt is fixed rate. So, as a result, the transmission mechanism of monetary policy has been weak, meaning that interest rate hikes have had a limited impact on the consumer.
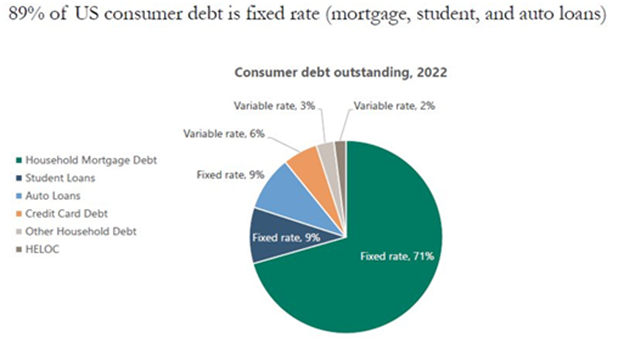
Source: Apollo
Starboard US Activist Fund Launch*
As you may know, accessing the premier US alternative funds is difficult to impossible for most of those funds. We have secured exclusive access to Starboard, one of the longer-tenured and successful US hedge funds. It is also one of the most feared by corporate America, since they are one of the most successful activist funds of all time.
Introduction to Starboard Value and Opportunity Fund: An Activist Long-Short US Hedge Fund
This long-short hedge fund is the first U.S. hedge fund where RBC benefits from exclusivity in the Canadian market. Jeff Smith, CEO and CIO of Starboard, is one of the most respected – and in come cases – feared activist investors in the world. Starboard has a 21-year track record running a value oriented activist fund. The strategy has produced a 12% long-term return, beating all US market indices over this period and generating this return with half the volatility of the S&P 500 and Russell 2000 indices.
The Starboard Value and Opportunity Fund does not have a “target return” but expects to generate a return, net of fees, in line with or excess of the Russell 2000 Index at half the volatility. The portfolio will typically hold 25-40 names (subject to change) with half being lead positions where Starboard has publicly announced their involvement with the company. The Fund “targets” a net return 200-300 basis points above the Russell 2000 Small Cap Index.
Strategic Fit: A High Quality Differentiated Offering
- High Quality
- Starboard has a proven ability to generate consistent returns, manage downside risk, and actively find new opportunities over time
- Mix of strong returns and low volatility stands out versus global activist peer group
- Differentiated Product Offering
- Minimal overlap with what is available in the Canadian market (not many activist funds)
- U.S. mid and small-cap space tends to be underrepresented in client portfolios
- Unique opportunity to get exclusive access to a top global manager
Tactical Fit: Why Now? Timeliness of Midcaps/Small Caps
- Mid and small caps are a timely trade as the category is relatively cheap right now and client portfolios often have an existing tilt to U.S. large-cap names
- This tilt to large cap equities has been for an extended period of time so accessing complementary exposure to mid and small caps in a downside-controlled manner is desirable
Exhibit 1:10-Year Annualized Performance: Starboard Outperformed the Russell 2000 Index
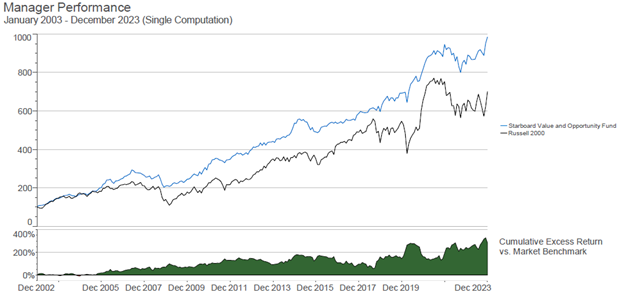
Source: StyleAdvisor as of December 31, 2023
Terms of RBC Exclusivity and Offering Timeline
The Starboard Value and Opportunity Canada Access Fund (V&O Fund) is a Canadian feeder fund that has been created exclusively for RBC clients to access Starboard’s flagship strategy, the Starboard V&O Master Fund. This fund will be exclusive to RBC for at least a 12-month period (from date of first monthly closing which will be June 1, 2024), potentially longer.
Background Information - Flagship Strategy with Strong 20+ Year Track Record
Strong Performance with Lower Volatility and Beta: As demonstrated in the chart above Starboard’s V&O Fund has a strong 20+ year track record where they have outperformed both the S&P 500 and the Russell 2000 Small Cap Index at a lower volatility and beta as compared to the index. The manager uses a fundamental, bottom-up investment approach while incorporating macro factors.
A History of Relative Outperformance in Challenging Markets: Starboard has historically generated superior risk-adjusted returns without using leverage. The chart below highlights Starboard’s standout relative performance during challenging year’s when the market was under pressure.
Exhibit 2: Since Inception the Fund’s Annual Net Returns Highlight Downside Protection During Periods of Market Stress
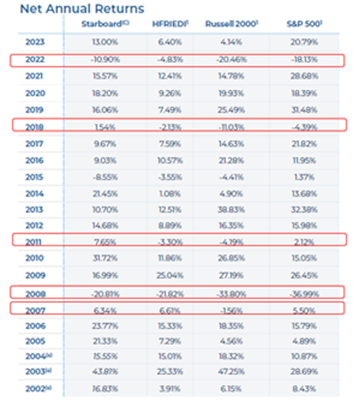
Source: Starboard Value LP data as of October 31, 2023
Zooming in more closely and looking at monthly returns illustrates a pattern of relative performance successes for Starboard during challenging periods for the broader market, but in contrast the performance in the strongest months for the overall market emphasizes the manager’s ability to hedge positions does not detract too much from their ability to participate on the upside. This mix of limited downside participation (historically 25-30%) and healthy upside capture (historical ~50%) has enabled the V&O Fund to generate superior risk-adjusted returns without using leverage.
Client Suitability: This fund is for investors seeking investment in a diversified and hedged portfolio of mid and small cap equities predominantly in North America. This is not a liquid product. Liquidity may be limited, and investors may not be able to redeem their entire investment on demand. Investors should invest with a longer-term horizon of at least 5 years. Investors must qualify as Accredited Investors.