" When I am asked what I worry about in the market, the answer usually is “nothing”, because everyone else in the market seems to spend an inordinate amount of time worrying, and so all of the relevant worries seem to be covered. My worries won’t have any impact except to detract from something much more useful, which is trying to make good long-term investment decisions." – Bill Miller
Note that the contents of this memo are all my thoughts, and not the views of RBC Dominion Securities. As well, no part of this content was AI-assisted or created.
Friends & Partners,
“Just because something hasn’t happened for you yet doesn’t mean it won’t.” – Motivational Speakers Everywhere
But that can be applied to today’s markets as well – things are ‘priced to perfection’ (or nearly) across many markets. This doesn’t mean things can’t continue to go up – the markets can remain in one direction much longer than many anticipate. But we need to exercise some caution and respect the risks.
As long as economic growth holds up (so far so good), high interest rates set by the Central Banks and higher inflation will be tolerated by this bullish market. But growth is the key variable as an economic slowdown is not priced into the market with the US equity market trading at a never-before-sustained multiple of 21.5x expected current-year earnings.
To be sure, history has proven on multiple occasions that markets can remain irrational longer than even the most seasoned investors can remain solvent, which is why it is usually a fool’s errand to try to ‘time’ markets and take extreme views one way or the other in your portfolio positioning. But we can certainly be tactical and prepare accordingly.
The bullish fundamental mantra for 2024 is so far intact based on the expectations for 1) imminent interest rate cuts this year, 2) continued disinflation, 3) resilient growth, and 4) ongoing optimism towards the theme of Artificial Intelligence.
When it comes to the economy, the story of 2024 has gone to ‘no landing’ (meaning the economy doesn’t enter a recession) from ‘soft-landing’ calls (many assumed a shallow recession) – at least so far. Continued economic strength paired with still-strong employment has caught many by surprise. Investors have been cautious in their economic outlook, and keep lowering their expectation of how many Central Bank cuts there will be this year (maybe none in the end?!), and markets continue to climb the classic “wall of worry” as it often does (remember Covid when markets were strong throughout summer and into winter of 2020?). Readers should not forget that the main market trend last year was the rush into cash (a record $1.3 trillion went into global money market funds).
Inflation may not be permanently dead either (as markets currently assume) – in prior episodes, it came back in fits and spurts before it died down. A research paper looked at the 24 largest major developed economies over the last 100 years, and there were 62 periods where inflation went above 5 or 6%. In 87% of those, it took multiple waves of inflation for it to subside. So, in the next cycle, inflation could come back much earlier due to supply shortages in areas like housing, commodities, and labour.

So, are we in a bubble today? That’s a good question. When it comes to Artificial Intelligence, I expand on this further in the section below. In short, we don’t know we’re in a bubble until after it bursts, but there are elements of this rally that feels eerily similar to the tech boom; if you were around for that. You can be right about a trend and adoption of a new technology or theme – but that doesn’t mean that the associated stock prices are properly reflective of those prospects at the time. Where are we when it comes to Artificial Intelligence in the markets?...

Some Other Interesting Things to Highlight + Events
I was honoured to host an esteemed table at the Women for Women's luncheon for International Women’s Day for Women's College Hospital - it may have been one of the most impactful and inspiring events I have attended. The message certainly resonated as over $900k was raised during the event, topped off by Margie Norrie McCain's $4mm donation.

I hosted Olympic Bronze Medalist Marion Thenault to spend time with the kids and speak at Beaver Valley Ski Club on March 2nd. She is inspiring and has a wonderful story, and came through the RBC Training Ground program. Marion flew to Kazakhstan the next day and won that world cup event!

Artificial Intelligence – Is This A Bubble Or Not?*
Bubbles are exciting, exhilarating – and dangerous. The parallels of Artificial Intelligence (AI) to the internet and tech bubble of the late 1990’s/early 2000’s is unmistakable. We’ve seen mini bubbles along the way as well since then (Cannabis rocketed and basically went to zero, and clean energy went up over 300% in a year in 2020, and has dropped 83% since then), and many over history (Mississippi Company, tulip mania, South Sea trading or the railway bubbles). A new technology or theme grabs the public interest (and $) as it promises to dramatically improve lives and productivity (in the case of tech), and ‘change the world’. Most people didn’t really understand how it worked but could see the hoped for benefits (tech, fiber, crypto, artificial intelligence?).
Investors often get overexcited about new technologies because they don’t consider the inevitable implementation issues. One can have a great idea, prove the concept, yet usually face a long, hard road to executing at scale and making real profits.
The tech boom era ended badly for most investors, not because they were wrong but because they were early, and excitement outpaced reality. The technology overall was real and would eventually achieve what it promised. Will the AI capex cycle end up similar to fiber in the dot com bust? Investors were right about adoption but chased valuations, ending poorly:

Artificial intelligence has even greater promise. I believe it’s quite real, yet experience and research tells me achieving it on a world-changing scale will be tough. Energy is a top obstacle to AI that few are talking about so far. AI systems consume truly gargantuan amounts of electricity. Where it will come from is not clear to me.
One of finance’s greatest minds, Jeremy Grantham, sums up the bubble question well:
“Every technological revolution like this – going back from the internet to telephones, railroads, or canals – has been accompanied by early massive hype and a stock market bubble as investors focus on the ultimate possibilities of the technology, pricing most of the very long-term potential immediately into current market prices. And many such revolutions are in the end often as transformative as those early investors could see and sometimes even more so – but only after a substantial period of disappointment during which the initial bubble bursts. Thus, as the most remarkable example of the tech bubble, Amazon led the speculative market, rising 21 times from the beginning of 1998 to its 1999 peak, only to decline by an almost inconceivable 92% from 2000 to 2002, before inheriting half the retail world!”
There is no standardization in how big a bubble can get, how long it will last, or what causes it to start its descent. But there are two constants when investing in potential bubbles – markets almost always go too far both ways. Inevitably, gravity exerts its force.
There Are Lots of Reasons To Remain Positive*
There are always reasons to remain positive, as the markets usually do a great job of proving naysayers wrong. During the recent cycle for example, traditional signals like inverted yield curves, leading economic indicators turning down or the huge rotation in consumer spending from goods to services exaggerated the danger of recession and were misleading. At least so far.
Sharp economic slowdowns occur when households and businesses get caught out over their skis and are forced to cut back quickly (including employment declines), triggering a self-reinforcing dynamic and a reflexive recessionary process. But since we’ve spent the last few years in a “pre-recession”, the economy has built war chests to prepare.
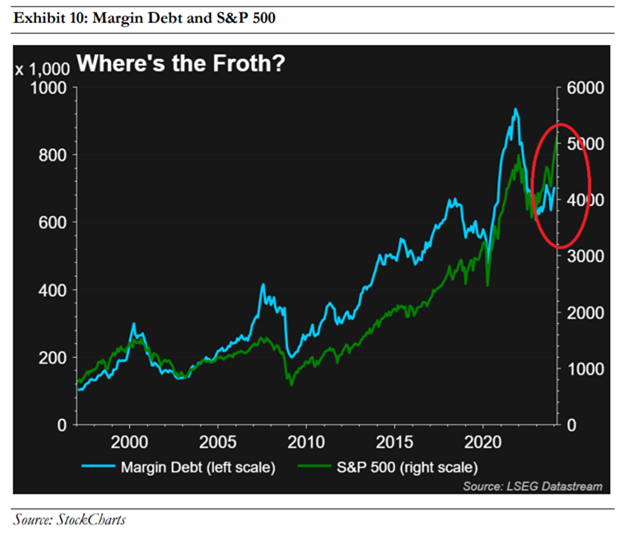
While markets have been on a hell of a run, but market tops are characterized by excessive speculation. This is easily measured by margin debt growth – the latest readings show that while margin debt is rising, it’s not crowded yet, showing that the public isn’t ‘all in’ and stock prices can continue to rise on this:
Markets may well be in a cyclical recovery. With the S&P 500 at ~21x forward earnings, note that its 5-year average is 19.0x and 10-year average is 17.7x. Valuations are elevated but not wildly excessive.

The market is not the economy, and the economy is not the market, but they’re inextricably linked over time. And the U.S. economy remains resilient: The U.S. continues to outperform its global peers, with recent manufacturing and labour market data suggesting the economy is on track to end the first quarter of the year on solid footing. Business activity in the manufacturing sector is showing signs of improvement, driven by notable expansions in output and employment. S&P Global U.S. Manufacturing Purchasing Managers’ Index edged higher, marking a 21-month high while remaining above the 50 level that separates expansion from contraction. Labour market conditions have proven resilient as well. The number of new claims for unemployment benefits unexpectedly dropped recently, while job creation measured by nonfarm payrolls surprised to the upside in January and February. The latest figures suggest the U.S. economic expansion remains intact, fueling expectations for a ‘soft’ or ‘no’ landing for the U.S. economy.
Continued Reason For Caution – Mind the Potholes!*
We can’t have an inverted yield curve for this long, and data points like the below without noting that the risk of recession isn’t zero (like many would have you believe today):

Most know that US markets ain’t cheap, perhaps it’s time to look for value elsewhere (we have been):

As well, the current Shiller P/E is ~34x, and is in the top 1% of history. Relative profits are at near-record levels as well. There has never been a sustained rally starting from a 34x Shiller P/E. The only bull markets that continued high from these valuation levels were Japan until 1989, and the U.S. tech bubble of 1999, and both ended poorly. Also note that there has never been a sustained rally starting from full employment, which is where we are today.
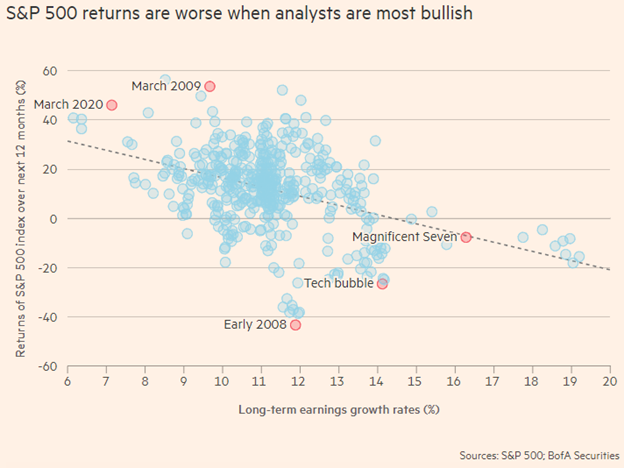
On top of all this, Research Analysts are pretty bullish today. And not shockingly, equity returns tend to be weaker when earnings growth expectations are elevated. When the good news is baked in, there isn’t much opportunity to go higher: “Analysts’ expectations of long-term earnings growth tend to correlate with higher prices for U.S. stocks and hence lower returns often follow, an analysis by Bank of America found.”
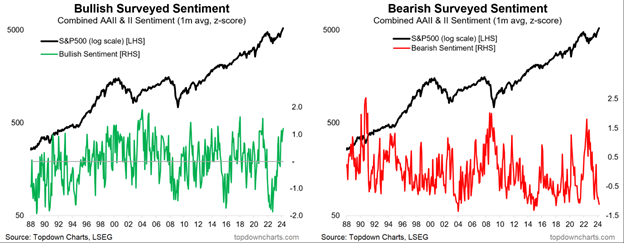
You know that when everyone is saying one thing, it may be time to consider the other. And everyone is bullish. This pair of charts shows the path of bulls and bears in the AAII and II surveys (the longest running sentiment surveys) — they show at once, how the current cyclical bull market emerged (from the previous collapse in bullishness and surge to rare heights in bearishness)… but also the current state of things: despite a vocal minority, most people are bullish, and bears are gone.
Commercial real estate continues to haunt us, and is lurking in the weeds. The vacancy rate for U.S. office space is approaching 20%, which is quite high. And this is in a strong economy with a strong labor market. If the unemployment rate starts rising because of the lagged effects of Fed hikes, the office vacancy rate will increase even more. The implication for some banks and the overall system are meaningful:

Finally, liquidity remains a headwind and concern. Looming large monetary headwinds raise the risk of a traditional recession into 2024. We are quickly approaching a period of time where liquidity conditions may come under pressure in the U.S. financial system. A portion of the recent equity run was buoyed by persistent liquidity injections coming from a number of sources. Much of this liquidity is expected to come under pressure near-term, which could offer a challenge to markets going forward and could potentially open a window for a widening of corporate credit spreads, multiple compression in equities, and ultimately a tightening of financial conditions. [For the financially sophisticated reader of this, here are the basic details: the reverse repo facility is not far from ending (as part of quantitative tightening), likely in Q2 of this year. An end to the Bank Term Funding Program (BTFP) poses risk to liquidity as well and banks will have to get higher cost funding.]

When it comes to the yield curve, it’s not the inversion that hurts, it’s the un-inversion – see chart below, watch for when all 3 lines turn higher (as a coincident/near-time recession indicator). All 3 lines measure the maturity of the business cycle (and turning points), and are calling that this cycle is getting long in the tooth, and turning:

We’re In A US Election Year – Usually Volatile, But Don’t Go And Sell Everything*
Prior to heading to the polls, election years tend to exhibit heightened uncertainty. Fiscal policies set out by the government can have significant impacts to the overall economy. Hence, prior to knowing the officially elected party and their plan of action, the unknown direction of the economy can cause heightened market volatility.

Non-election years have on average performed better than election years. Regardless, attractive returns have been consistently produced over time for both scenarios.
History has shown this. Since 1984, the average annual volatility of the S&P 500 was 16% on non-election years, and 19% on election years- an increase of 3%. Since 1984, the below chart shows the S&P 500 median annual cumulative performance for election years compared to non-election years:

Source: Morningstar, RBC GAM. From January 1, 1984 to December 31, 2023. S&P 500 TR Index. Results use daily median cumulative return.
However, we are tracking well ahead of usual performance in an election year…

Key takeaways:
- Since 1984, the S&P 500 provided a median cumulative return of 17.2% for non-election years, compared to 11.4% on election years.
- Although a significant rally generally occurs after the election, waiting until after the election means missing out on modest gains. Leading up to election day, the historical median return is roughly 4%-5% throughout the year.
- While non-election years historically outperformed election years, average annual returns have been in the double-digits % regardless of the year. This highlights the essential message that staying in the market can produce attractive returns, regardless of whether it’s an election year or not.