
How to Trade Within a Range
In the November 1st editorial I switched my view from a “BEAR” market to a “Range Bound” market. The catalyst for this switch was that interest rate increases appear to be nearing the end point, Hopefully, this will see them go into a holding pattern early next year. Range trading can work well for a portion of investible assets in a sideways market under the correct conditions.
Gradually, more of you are contacting me and saying you would like to add a range trading component to your portfolios. Great! It is my passion so I am happy to share it.
Let’s do some basic housekeeping as to what is needed to do this:
- Range trading requires the investor to expect and accept small losses trades against gains booked when we get the range trade right. If activity makes you nervous, range trading is not for you.
- If you don’t already have one, we need to set up an account where you pay an annual fee and not a per trade commission to trade. I expect about 35-50 trades in a year. The minimum account size to open is $250,000 to qualify for this many trades.
- The annual cost for this account varies depending upon what you want to trade and how much money is added to the account. The fee for service range is between 0.85% - 1.75% per year on assets.
- We need to do a short review of your financial plan to figure out what portion of your assets would be sensible to put into a trading strategy.
- We need to decide how you want to set your “stop losses” on positions we add in the portfolio. (Risk Controls)
Now let’s look at how the process works.
The idea begins at the chart I have been posting the past few weeks. (Shown below).
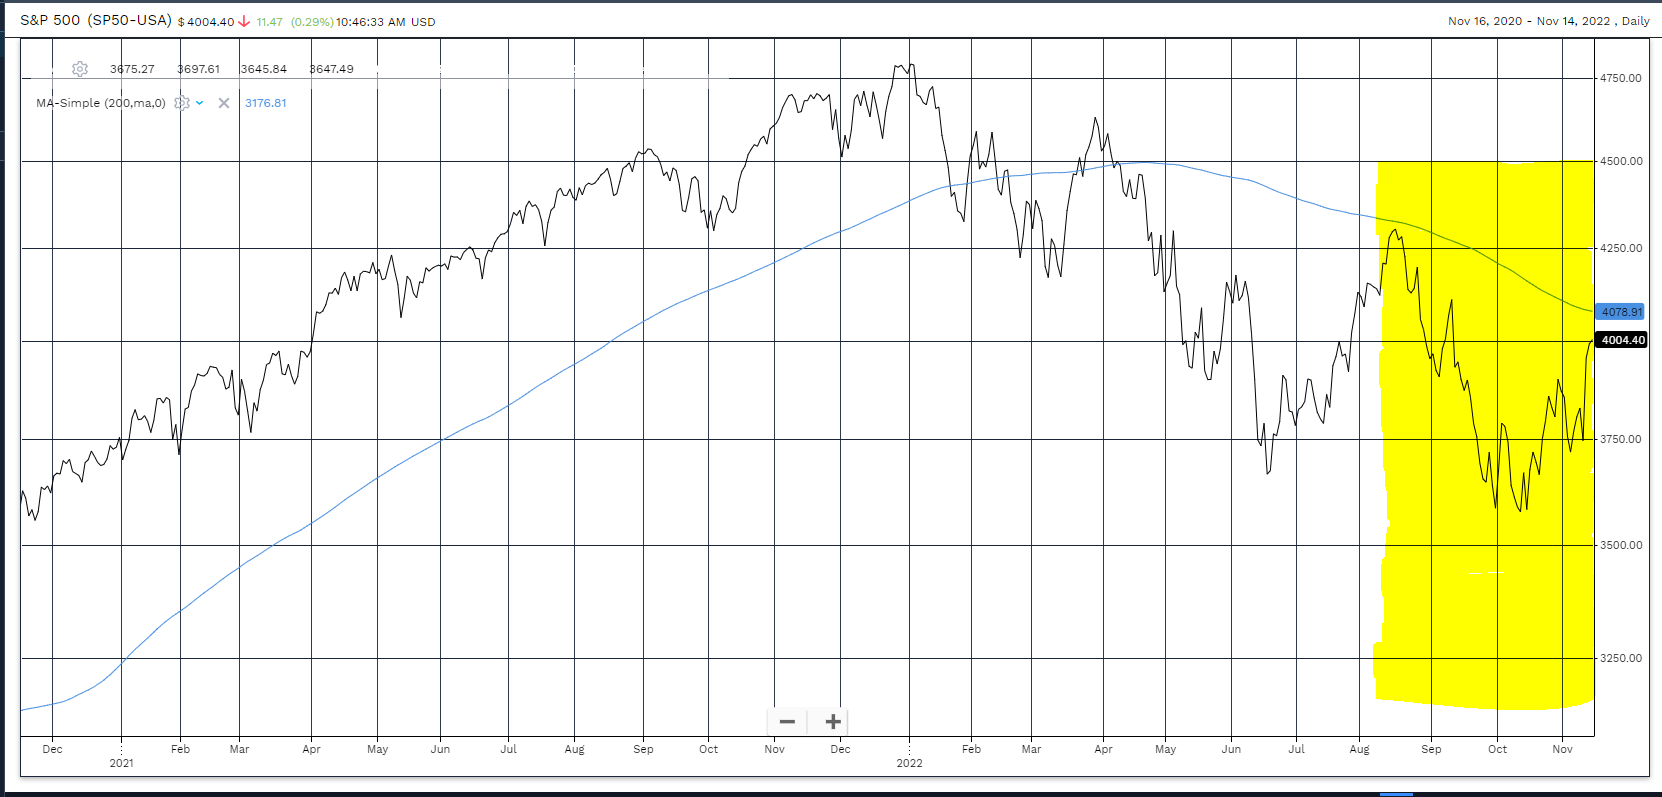
This is where we proxy the overall positioning of the broad stock market by using the S&P500.
Next we zero in a little closer and look at the shorter term “risk ranges” for some key assets. The following graphic gives you an idea as to the types of indicators I look at. This graphic shows the past 5 days of “risk ranges” and whether the asset class is BULLISH or BEARISH trend. (Green BULLISH and red BEARISH).
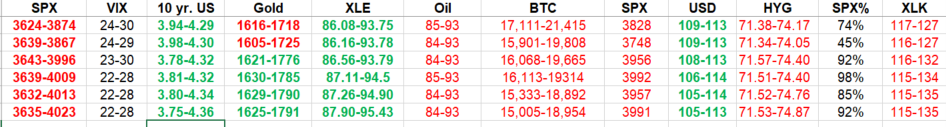
The idea is to add exposure at the low end of the risk range and lighten up at the high end. That is easier said than done. The process uses the correlations of different risk ranges to decide on the timing of entry and exit points.
It doesn’t matter if you are familiar with all of these symbols and how they relate to each other…they mean something to me, kind of like notes on a page to a musician.
When the conditions are right, we enter a range trade and use a stop loss to control the downside risk. Every risk range trade added has a known stop loss point. That is an important feature of the strategy.
Since this is a public editorial, that is about as much of what I do that I want to write in this forum. If you are interested in more information, please contact me and we will get you set up to add this investment arrow to your portfolio quiver.
The Elusive Central Bank Pivot to Lowering Interest Rates
The following synopsis is taken from the 34 page slide deck used by Federal Reserve member, James Bullard, in his November 17th address in Louisville, Kentucky.
Summary: “Inflation remains unacceptably high, well in excess of the FOMC target of 2%. Our actions to curb inflation include higher interest rates and balance sheet reduction. Thus far, the change in monetary policy stance appears to have had only limited effects on observed inflation, but market pricing suggest disinflation is expected in 2023.
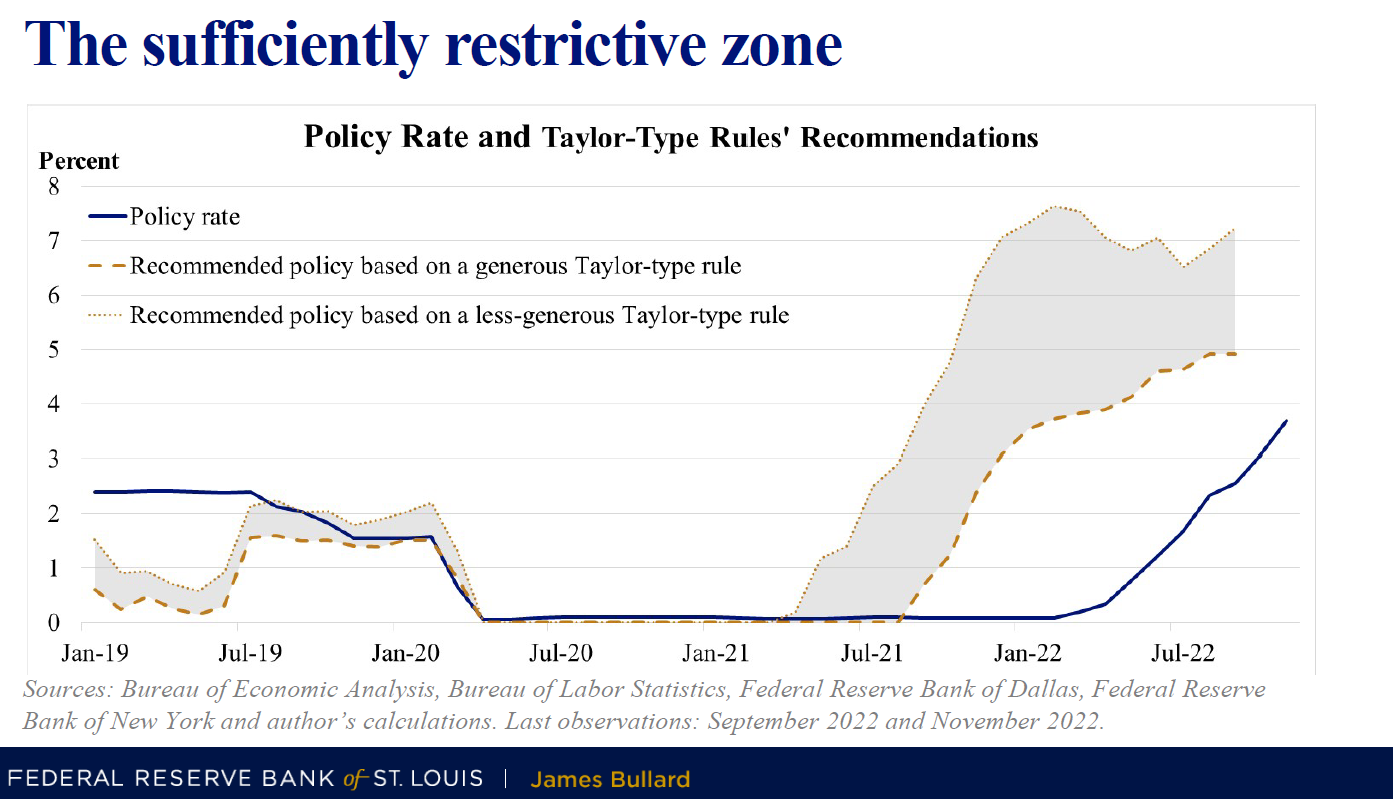
The graphic above from the presentation shows the historical Fed policy rate in blue and the shaded area represents the range where the Taylor Rule signals the terminal interest rate exists under present economic conditions.
What this is telling us is two important points that the narrative machine of Wall Street does not want to concede:
- Interest rates are still going higher, albeit at a slower rate of increase.
- Once in the Taylor Rule target zone, interest rates will stay in the range unless something breaks in the REAL economy.
Let’s add a couple more graphics. Jim Bianco of Bianco Research LLC published this chart last week that looked at money supply NOT INCLUDING the US. The top window is cumulative and the bottom is rate of change. (ROC)
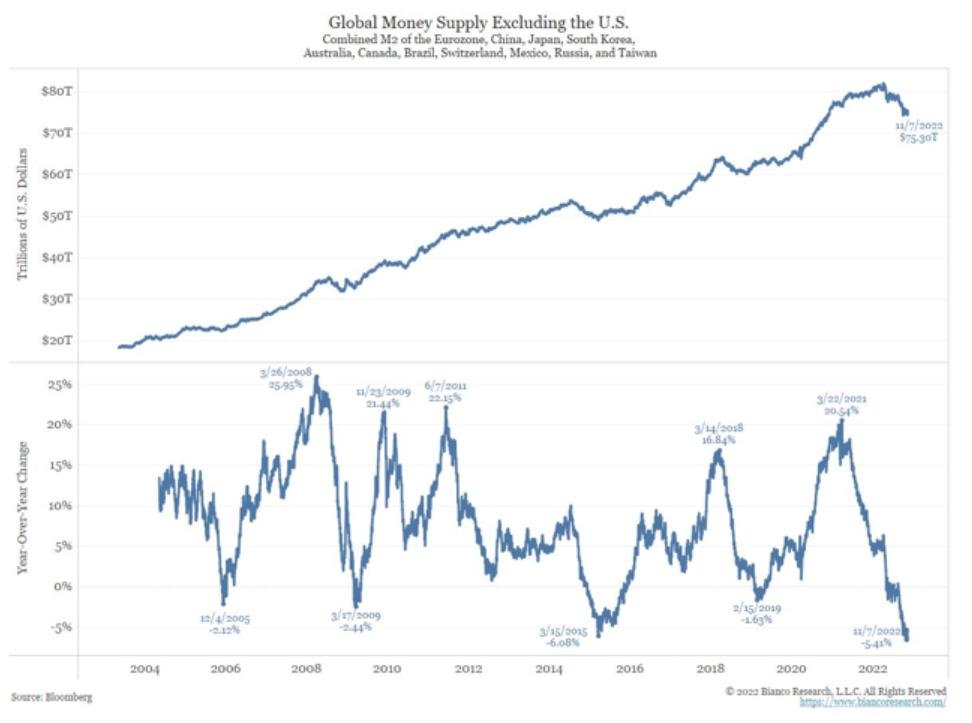
As you all know, I watch rate of change much closer than cumulative. This chart tells us the entire world is becoming more restrictive in terms of central bank liquidity.
Just to complete the picture, below is the same data including the US.
This is why it is important to not try to see the end of the BEAR market as the beginning of a new BULL market. The unwinding of 40 years of overly simulative monetary policy is not going to happen in 9 months. It will take time.
Stay patient and pick your opportunities. There will be some fantastic opportunities in the coming year to take advantage of for those who are ready.