
More Evidence that the Cheap Money
Economy has Ended
There are three ways to get rid of excessive debt:
- Repay the principle
- Default on the interest payments and/or principle
- Inflate it away
(Remember, only Central Banks can use option 3. Which one do you think is easiest to choose?)
Old Wall Street Adage:
“Bulls make money, Bears make money, Pigs get slaughtered”
We will drill down into the meat of what is going on in a few paragraphs but I want to highlight just how important it is to identify early when something is changing in the financial markets. By shifting your view early and watching for confirmation of our thesis shift, we can avoid some common mistakes and hopefully navigate the changing conditions better.
There are some early signs that the BEAR market for stocks is ending. The trouble with saying that is that investors automatically conclude that a BULL market is starting. I don’t think that is the case.
My thesis is based upon two ideas:
- Central banks will keep raising interest rates (more slowly from here) for longer than consensus believes.
- Politicians will send out more and more free money to their constituents at the same time and therefore fuel the inflation in the system.
Honestly, this is hardly a thesis since it is happening already. In the past week we saw the Bank of Canada (BOC) raise interest rates 0.50%, the European Central Bank (ECB) raise 0.75% and the US Federal Reserve raise 0.75%. The only central bank to have stayed with the money-printing theme was the Bank of Japan. (Honestly, Japan is so screwed up from a central bank perspective I’m not even going to start…).
At the same time as these decisions are being made, politicians are still trying to help inflation-strapped consumers with more free money.
This is contradictive behavior. (Think of the central bank as the brake pedal and the politicians as the gas).

In a nutshell, by working against each other, central banks and political leaders are embedding high inflation into the financial system and creating an environment where interest rates will have to keep going higher.
What happens if interest rates stay higher for longer?
Clearly the impacts in residential real estate are becoming significant on a global basis. Volumes of sales have been waning for months and now prices have started trending lower, even in the US.
For stock and bond markets, a lot of the damage has already been inflicted. Even after a week of relatively strong equity and bond market performance the distances away from all-time high prices for many companies is 35% or more.
Technology company earnings and outlooks have been hit worse than the general market. Tech companies with weaker cash flows or no real earnings are stuck in a tough place when they can’t borrow cheaply and their share prices are down 50% or more.
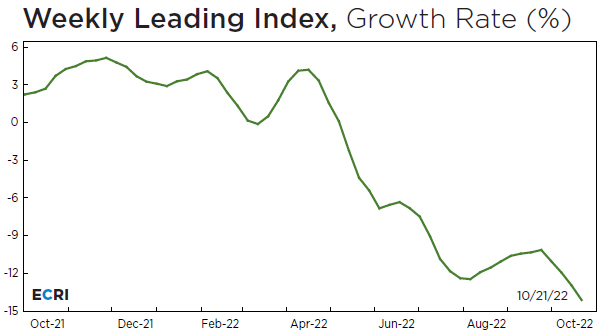
The bottom line is that interest rates are still going higher in an environment where global growth is still slowing. (US shown below)
How I interpret these happenings in terms of looking forward is still to visualize a compression of the trading ranges for both stocks and bonds and longer term downside for real estate prices.
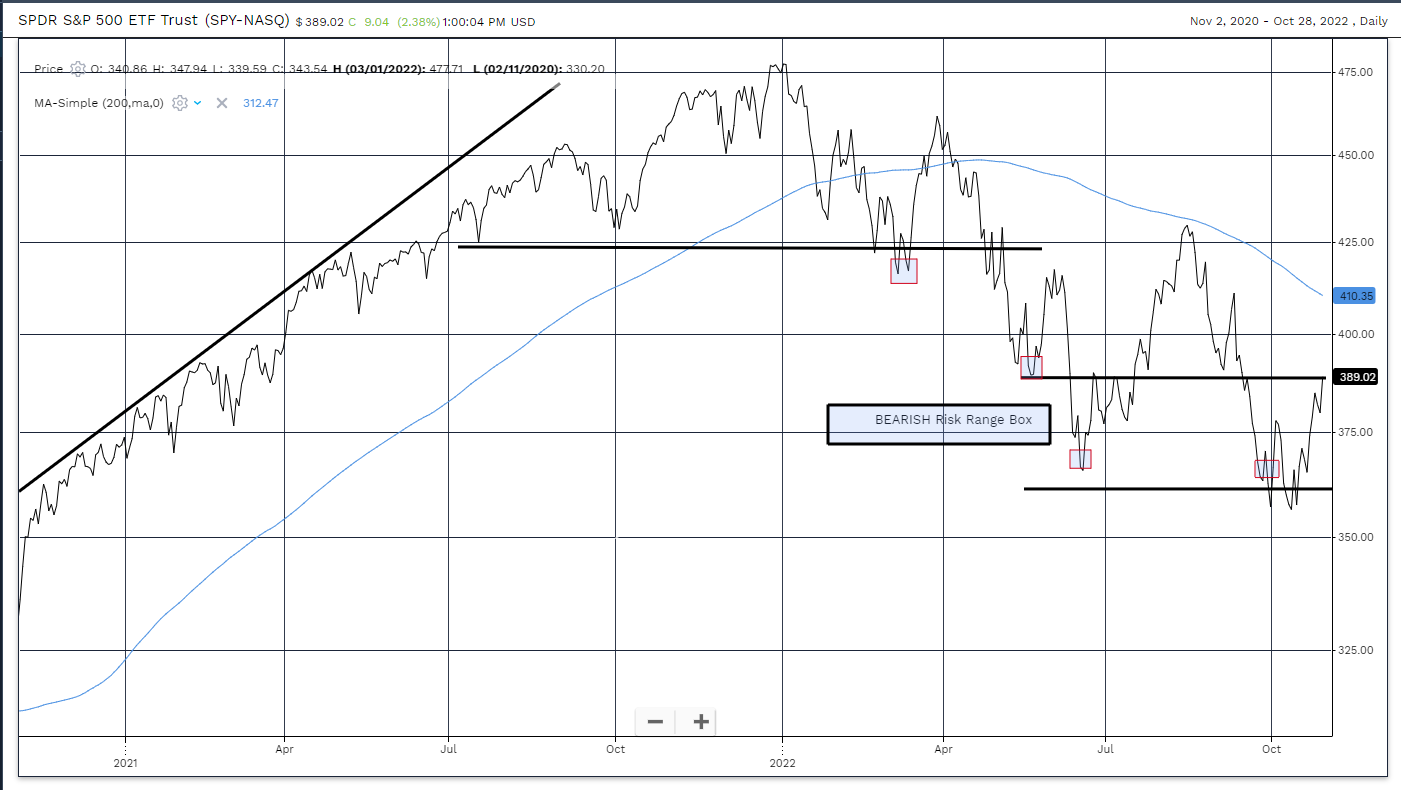
Going back to my favourite S&P500 chart you can see the index has moved back to the top of the range. The top end of the risk range box has stayed constant during this BEAR market. The bottom end of the risk range box has moved lower by 65 S&P500 points.
All of the above brings me to what appears to be a longer term conclusion. The BEAR market in stock prices is transitioning into a longer term sideways trend in a wide range for the next six months.
This is a good news theme for longer term investor if they embrace the idea and use it to their advantage. Here is what I am thinking.
The S&P500 chart below uses a shaded red box to expand the risk range to a longer term risk range expectation. The top end of the risk range becomes 4475 and lower end 3400.
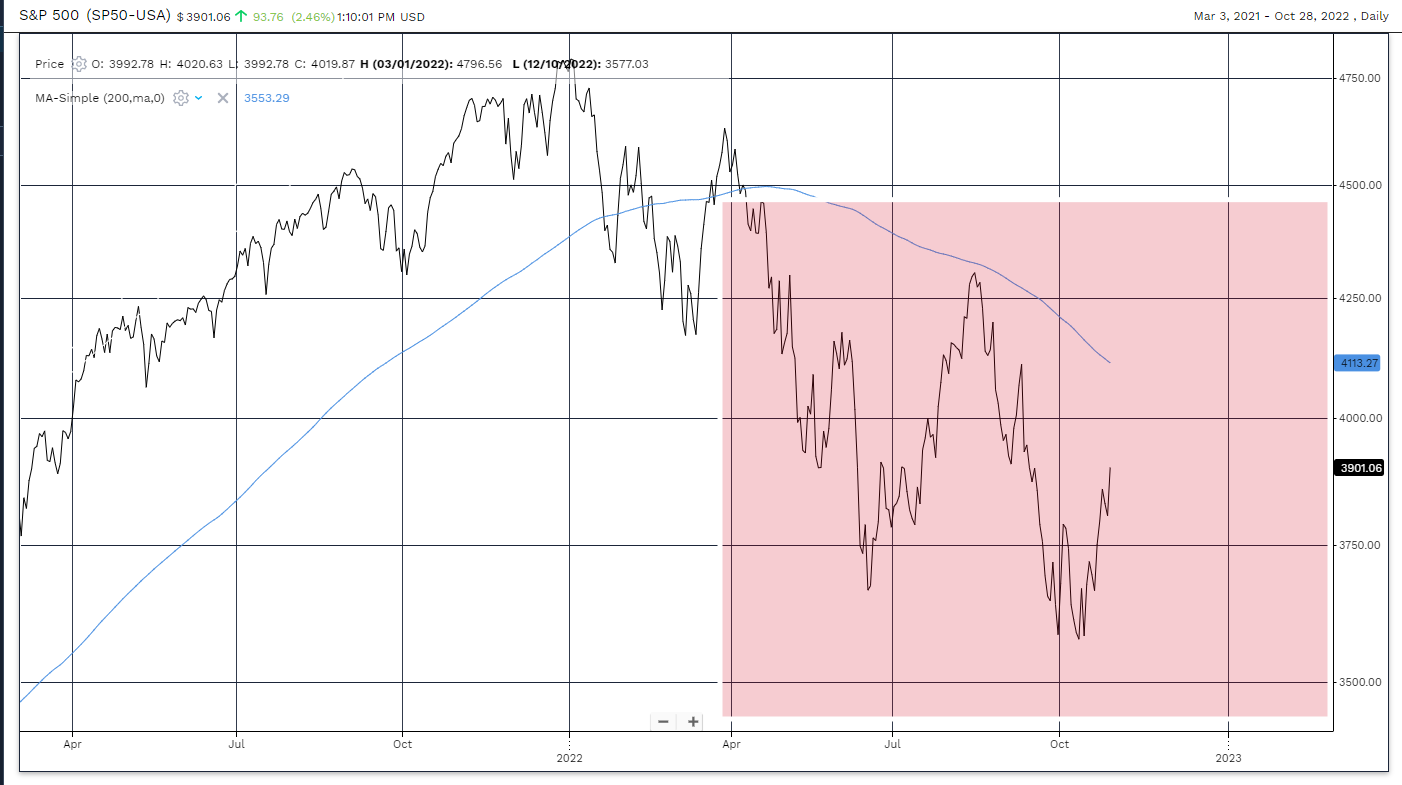
What if we worked with a thesis that said the S&P500 was going to spend 95% of its time in the next 3 years inside of this shaded red box?
The logical thing to do would be to try and add stock market exposure below 3650 and to reduce exposure over 4150. (In increments of a percentage of your portfolio).
Something to think about….
Let me build the case a little stronger for you. Below is a logarithmic chart of the S&P500 from 1920 to present. What I have done is added long term sideways trends in the S&P index resulting after long term BULL markets.
The first highlight goes from 1929 to 1950. The second from 1968 to 1981. The third from 2000 to 2014. Of course, I have just added the fourth.
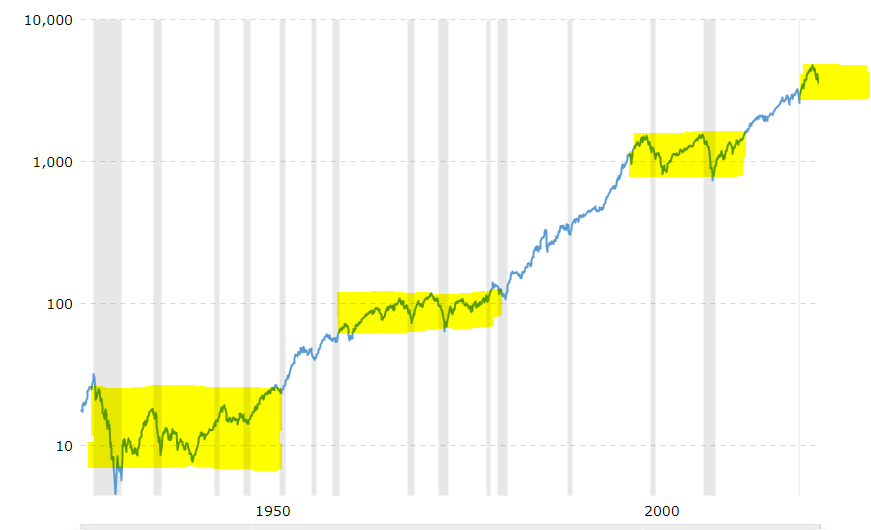
There are two points that I want to make with this thesis:
- There is historical precedence for long term sideways moves in stock indexes.
- Investors need to approach their portfolios from a different perspective in terms of activity than they do in BULL markets.
The end of the cheap money era in finance could easily fit the criteria for creating another of these long term sideways moves. The latest set of earnings from the technology sector shows how great the impact of higher interest rates is on their businesses.
Until the world decides to go back to free money and Quantitative Easing I submit this thesis needs to be considered.
I welcome your feedback.