| | | |
| | | |
| | How We See It Overview: We enter mid-April 2025 with a cautiously optimistic stance, balancing defensive positions with targeted opportunities. Market volatility has surged recently due to escalating U.S. trade tariffs, political uncertainty, and divergent economic signals. Our investment committee believes in staying invested but vigilant, focusing on high-quality companies and diversification. Let's be honest - even though we've all seen the long-term stock charts that rise steadily from left to right, it never feels like that in the moment. Right now, things feel bumpy. Markets are volatile. Headlines are unsettling. Whether it's new trade tariffs, recession worries, or political noise, the emotional side of investing can be exhausting - even for seasoned investors. And yet, moments like these are exactly when discipline matters most. Our investment philosophy isn’t just about picking the right stocks or timing the right entry or exit… a fools game as we’ve illustrated before — it’s built around a disciplined, process-driven framework that we apply regardless of the noise. A core part of that discipline is rebalancing portfolios. Rebalancing isn’t exciting. It’s not flashy. But it’s powerful. It means that when one part of your portfolio performs better than the rest, we trim it back and add to areas that have become undervalued. It’s a risk management tool, but also a value-seeking tool — it ensures your portfolio doesn’t drift too far from the strategy we’ve carefully built together. We also remain focused on the cash flow your portfolio generates — dividends from companies, distributions from ETFs, and interest from fixed income. These income streams remain remarkably steady, even when markets don’t. That’s not a coincidence — it’s by design. Many of the companies we own in your portfolio have raised their dividends consistently over time, and the income they pay you doesn’t change just because prices are down for a few weeks. So yes, it doesn't feel good right now. And we won't pretend otherwise. But feelings and fundamentals are not always aligned. We don't ignore your feelings - we just don't let them dictate long-term decisions. What we do instead is remain methodical, proactive, and focused on what we can control - rebalancing portfolios when the numbers tell us to, owning investments that pay us to be patient, and communicating clearly with you every step of the way. That’s how real progress is made — not by reacting to every storm cloud, but by continuing to build, brick by brick, the financial future you’ve worked hard for. | |
| | Interesting Charts We’ve collected a few charts that caught our eye this week, each telling an important story about the market or economy: U.S. Tariffs Impact by Country: 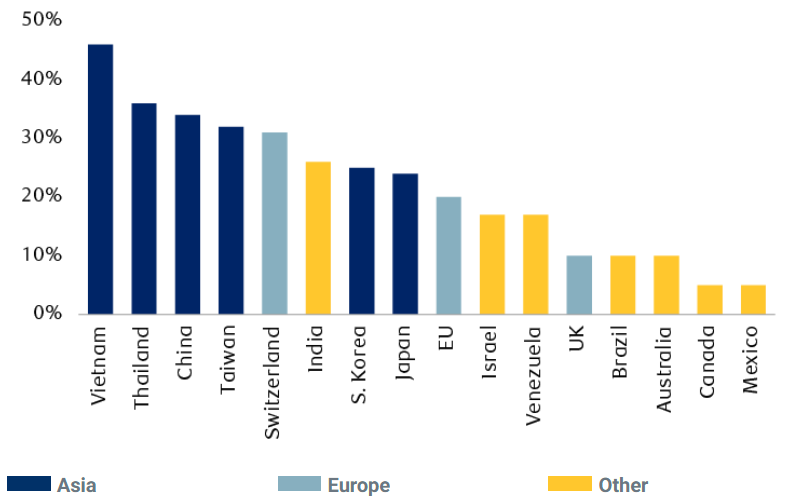
This chart highlights the breadth of the trade war – not just a U.S.-China spat, but impacting many partners. Investors can use this to gauge which markets/sectors might face pressure (e.g., countries with 30%+ tariffs may see slower growth, while the small 5% on Canada/Mexico suggests those economies are somewhat shielded relative to worst fears).
The volatility of a diversified portfolio decreases over time: 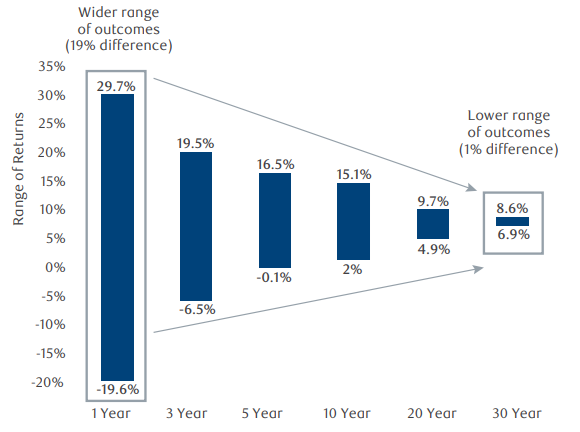
Insight: Use time to your advantage Investors who maintain perspective and stay mindful of their investment time horizon have a better chance of reaching their investment goals than those who react to short-term market fluctuations. Staying invested and trying not to “enter and exit” the markets when volatility increases can help reduce fluctuations over the long term. The longer an investment is held in a portfolio, the less chance it has of incurring a negative rate of return. This is because fluctuations in value tend to smooth out over time as the impact of market volatility diminishes. Moreover, years of strong equity markets can outweigh periods of decline, resulting in long-term returns that outperform other asset classes. So if you try and time the market by getting out and back in, every time, you reset your volatility back to 1 year. This is why maintaining discipline and rebalancing is a far superior strategy.
“Missing the Best Days” Chart: 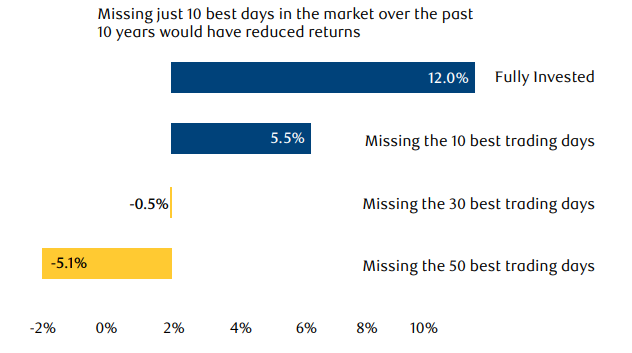
This chart shows the S&P 500 annualized return over the last 10 years (~13% if fully invested). If an investor missed just the 10 best days, that drops to ~6%. Miss 30 best days and returns are nearly zero. Miss 50 best days (out of ~2,500 trading days in a decade) and returns turn negative. Insight: It powerfully visualizes why market timing can hurt. The best days often cluster around the worst days (big upswings happen amid volatility). If you sold in fear and missed the rebound, your long-term outcome deteriorated drastically. This chart encourages staying invested and maintaining a plan rather than trying to jump in and out. Each of these charts, in different ways, reinforces key themes: global events drive markets, sentiment can swing wildly, and discipline is critical. We believe in using data visualizations like these to cut through noise and help our clients see the big picture. | |
| | Tariffs and Trade Tensions: The biggest headline is the U.S. tariff deluge announced in early April. The White House unveiled sweeping tariffs on over 60 countries, far exceeding what investors expected. Many nations face tariffs above 30%, with Vietnam, Thailand, China, and Taiwan hit the hardest (40-50% rates). Even close partners Canada and Mexico face 5% tariffs on non-USMCA good. Equities: The S&P 500 plunged nearly 5% on the news (Nasdaq almost 6%) as investors processed the broad scope. Tech stocks suffered disproportionately due to supply chain links in Asia, while defensive sectors like Consumer Staples, Utilities, and Health Care outperformed. Toronto’s TSX similarly tumbled 3.8% on April 3 – its worst day in five years – with Tech down 9.5% (Shopify -20%) and Energy -7.1% as oil prices slid. Over just three sessions last week, the TSX shed over 8%, entering a correction (down 10%+) from its January high. Economy & Sentiment: Expert opinions are stark. Wharton’s Jeremy Siegel called the tariff escalation “the biggest policy mistake in 95 years.” Analysts warn prolonged trade war could tip economies into recession. Indeed, Canada’s March jobs report showed a loss of 33,000 jobs – the first drop in 3 years – as companies paused hiring amid uncertainty. In the U.S., recession risks are being openly debated given the combination of slowing growth and rising prices (stagflation) concerns. Political Uncertainty: U.S. & Canada: Politics are a wildcard. In Washington, tariff policy appears fluid and driven by negotiation tactics, leaving markets guessing. In Ottawa, Prime Minister Mark Carney called a snap federal election for April 28 amid the trade tumult, seeking a mandate to navigate the U.S. tensions. Polls are tight, and markets dislike uncertainty – another reason we expect some near-term volatility until there’s clarity on Canada’s leadership and trade strategy. Policy Response: The Bank of Canada (BoC) cut rates by 25 bps in March to 2.75% and signaled caution on further moves. Governor Tiff Macklem emphasized balancing upward inflation pressures (from tariffs raising costs) with downward growth pressures (from weaker demand). Markets are split on an April cut. The Fed held rates steady through Q1 but is increasingly expected to resume cutting as soon as this quarter if growth deteriorates. Fed Chair Powell indicated he’d err on the side of easing to cushion growth, even if inflation is above target. | |
| | Market Wisdom: RBC Wealth Management’s Take: RBC’s analysts note that while Q1 economic data held up better than sentiment (e.g., retail sales were resilient), the tariff shock is a game-changer. They foresee elevated volatility in the short run, and emphasize quality – companies that can thrive across cycles. They also point out a silver lining: consensus still expects mid-to-high single digit earnings growth for 2025 (a bit lower than earlier hopes). If trade issues abate, there’s room for an earnings-driven rebound later in the year. Edward Jones Strategy: Echoing our view, an Edward Jones strategist said last week, “Markets are clearly in risk-off, defensive mode… Investors may be hesitant to go long until we see what countermeasures emerge”. This captures the current mood: caution prevails, but that very caution can set the stage for relief rallies if worst-case outcomes are avoided. Historical Perspective: It’s worth recalling that markets have endured trade wars and political upheavals before. To paraphrase a veteran portfolio manager, “uncertainty is the only certainty.” Our job is to navigate it with discipline. We believe periods of volatility often present the best opportunities for long-term investors – a mindset we maintain while actively managing risks. | |
| | Canadian Markets – TSX Performance, Sectors, Earnings & Economy Recent Performance: After a strong start to 2025, the S&P/TSX Composite has hit turbulence. As of April 9, the TSX is off roughly 6% for the month and down 13% from its peak, largely due to trade-war-driven selloffs. Year-to-date, the index is now roughly down nearly 10%. - Drivers: Materials and Energy – two heavyweight sectors – have been whipsawed. Gold and precious metal stocks had buoyed the TSX through Q1 (gold prices hit all-time highs earlier this year), but even gold dipped on the tariff news as margin-call selling hit all assets. Oil prices plunged from ~$75 to the mid-$60s per barrel, dragging energy stocks; OPEC’s surprise output hike compounded the decline. Financials (-3% to -4% last week) were not spared either amid broader economic concerns.
- Defensive Resilience: One notable winner was Consumer Staples, the only TSX sector up on April 3. Loblaw Companies (L.TO), a major grocer, hit a record high as investors sought stable, domestic-focused businesses. Utility and telecom stocks (e.g., Hydro One, Telus) also held relatively firm, demonstrating the classic defensive playbook: when uncertainty rises, investors rotate into companies that provide essentials or have regulated cash flows.
Economic Data: Prior to the tariff shocks, Canadian data was surprisingly solid. GDP in Jan/Feb grew modestly and unemployment was at multi-decade lows (~5%). Inflation for February came in a bit hot at 2.6% YoY, above expectations, partly due to higher food and energy costs. The BoC’s easing cycle (total 225 bps of cuts over 9 months) had started to stimulate housing and consumer spending. However, forward-looking surveys signal caution: - The BoC’s Business Outlook Survey shows companies turning pessimistic. Over half of firms plan to pass tariff costs to consumers, which could lift cost of living. Both consumers and businesses reported lower confidence due to trade uncertainty.
- March jobs saw that 33k drop (concentrated in manufacturing and trade-related roles), breaking a long streak of gains. Wage growth is still decent (~3%), but if job losses continue, it could hit consumer spending.
- Thus far, housing has been resilient, with low mortgage rates spurring activity. It’s an open question if the election or any changes to housing policy will impact sentiment. We’ll watch this closely given housing’s weight in Canadian wealth.
Interest Rates & Currency: The Canadian dollar (CAD) has weakened to ~1.38 CAD per USD (down about 4% YTD) as oil fell and yield gaps widened. Bond yields have dropped – the 10-year GoC yield sits around 2.85%, down from ~3.25% pre-tariff crisis. This helps ease borrowing costs for consumers (e.g., 5-year fixed mortgage rates have edged down), but is also a sign of risk-aversion (flight to safety) benefiting government bonds. The Bank of Canada’s April 16 meeting is highly anticipated. With the overnight rate at 2.75%, markets are 50/50 on another 25 bps cut. The BoC may hold fire to assess how tariffs unfold (“wait-and-see approach” as RBC describes), but will be ready to cut if conditions worsen. We think an April cut is slightly less likely given the BoC has already acted seven meetings in a row – they may pause to maintain some ammunition. Earnings Season (Q1): Just kicking off in Canada. Thus far, Big Banks’ earnings (for Q1 fiscal, reported Feb) were better than feared. Royal Bank, TD, and CIBC all beat expectations in Feb, though their stock reactions were mixed (RBC fell on cautious outlook commentary). As we move into April/May, energy and mining company results will be key: - Energy: Canadian Natural Resources and Suncor report in early May – guidance on capex will be watched. An open question is whether they cut spending on new projects given price volatility.
- Materials: Gold miners like Barrick (ABX) likely had strong Q1 on record gold prices. Barrick is up ~5% this week, and Newmont (NEM) – though listed in the U.S. – is up ~30% YTD. These miners could continue to provide a hedge in portfolios if market turmoil persists.
Our Take on TSX: Canadian equities have shown they can “hold up quite well” in adversity, thanks to a sector mix that includes defensive plays (gold, telecom, utilities). The TSX also trades at a valuation discount to the U.S. S&P 500, which provides some cushion. We remain constructive on Canadian equities long-term, but in the near-term we are selective. Quality and resilience are our mantra – favoring companies that can maintain earnings if the economy softens. We also keep an eye on the Canadian consumer; any further weakness in jobs or confidence could impact retail, banking, and housing-related stocks. In contrast, exports (especially if CAD stays weak) and government spending could provide offsets. | |
| | U.S. Markets – S&P 500 & Nasdaq, Fed Actions, Sectors & Earnings Market Performance: U.S. equities have seesawed. After hitting all-time highs in mid-February, the S&P 500 has retrenched ~18% from its peak. As of April 9, the S&P 500 index trades around 5,050, down 15% year-to-date. The Nasdaq 100, heavy with tech, is down about 17% YTD and flirting with bear market territory (down ~20% from its high). Sector Rotation: A dramatic rotation is underway. Defensive sectors (Utilities, Consumer Staples, Health Care) and dividend payers have outperformed, while cyclicals and tech lag: - Example: Philip Morris (PM), a staple/dividend play, is one of the top S&P stocks of 2025, +32% YTD. Likewise, ConEd (ED), a utility, is +24%. In contrast, former high-flyers like Tesla (TSLA) are down ~36% YTD and chipmaker ON Semi (ON) is -35%. Even stalwarts Apple and Microsoft are each down ~10–11% as investors lock in profits from last year.
- Energy had rallied early in the year (with oil over $80 in Jan), but has since reversed. The S&P Energy sector is now negative YTD after oil’s drop. Financials are middling – benefiting from rising interest margins early on, but now weighed by recession fears and a flatter yield curve.
Fed & Rates: The Federal Reserve is in focus. After cutting rates late 2024, the Fed paused in Q1 but signaled in March that risks are rising (mentioning stagflation). Futures markets imply a cut by June is likely. Treasury yields reflect this: the 10-year yield has fallen to ~4.1% after topping 4.8% earlier this year. The yield curve is steepening slightly in anticipation of cuts – a typical pre-recession signal. Notably, municipal bonds underperformed Treasuries this quarter on fears the new administration might remove their tax-exempt status, though that’s speculation. Economic Indicators: The U.S. economy is a mixed bag: March nonfarm payrolls (released April 4) came in around +210k – deceleration from prior months but still solid, and unemployment stayed ~3.8%. Wage growth ~4%. - The labor market shows only mild cooling so far, which is encouraging.
- PMI surveys dipped under 50 (contraction) in March for manufacturing, and services PMIs slowed too, indicating the tariff uncertainty is dampening activity.
- Headline CPI for March is expected around 3.8% (down from >5% late 2024). But oil’s recent drop could further ease short-term inflation, giving the Fed cover to cut if needed. The risk is tariffs – new import taxes are inherently inflationary (tariffs are essentially a tax on consumers). The administration downplays this, but economists estimate the full tariff package could add ~0.5–1.0% to U.S. inflation over 12 months if fully passed on.
Earnings Season (Q1 in U.S.): About to ramp up. Expectations have been tempered: - S&P 500 earnings are forecast to grow ~5–7% for 2025 (down from ~10% expected pre-tariffs). We’ll be watching corporate commentary on tariffs. Companies may lower guidance or delay capex. Conversely, any who benefit (say, domestic producers gaining share) could shine.
- Big Tech: Apple, Microsoft report later in April; any softness in outlook (especially related to China supply or consumer demand) could weigh on indices. Conversely, their stock pullbacks mean valuations are more reasonable now.
- Financials: Big banks kick off next week. Loan growth and credit quality are key – so far, no signs of credit stress in the system, but we’ll listen for any uptick in delinquencies.
- Industrials: Boeing, Caterpillar, etc. will give a gauge on global trade impact. We suspect cautious tones.
Our Take on U.S. Stocks: We have not turned outright bearish – the U.S. market still offers innovative companies and global leaders – but we acknowledge near-term headwinds are strong. Thus: - We maintain neutral weight U.S. equities. Within that, we tilt to defensive/value segments (pharma, staples, selective REITs) and reduce some exposure to high-beta tech temporarily.
- We believe the Fed’s likely support (rate cuts) and still-positive earnings growth prevent a “deep bear” scenario, but a technical correction was perhaps overdue after 2024’s big rally.
- Look out 6–12 months: If trade tensions find resolution (even partial), pent-up business spending and easing financial conditions could ignite a late-year rally. So we want to stay positioned to capture upside while buffering the downside.
In sum, the U.S. market story now is “short-term caution, long-term opportunity.” We are positioning portfolios to endure the volatility of spring and be ready for potential strength later in the year. | |
| | Top Performers of the Week – Standout Stocks, ETFs, Sectors Even in a down week, there are winners. Here are some notable standouts from the past 5 trading days in Canada and the U.S.: | Category | Name (Ticker) | 1-Week Performance | Commentary | | Canada Stock | Loblaw Companies (L.TO) | +4.2% | Hitting all-time highs as investors flock to defensive, domestic grocers amid volatility. A classic “safety trade” benefiting from its stable consumer base. | | Canada Stock | Barrick Gold (ABX.TO) | +5.4% | Gold miner up as gold prices remain near highs. Gold is a haven; large central bank purchases and low rates fuel demand. Barrick’s production steady, seen as an inflation hedge. | | U.S. Stock | Philip Morris (PM) | +3.1% | Big tobacco with a high dividend – outperformed as bond yields fell and defensive stocks shined. PM is up ~32% YTD, showing how “old economy” defensives have come back in favor. | | U.S. Stock | Newmont (NEM) | +2.8% | The world’s largest gold miner (also listed TSX) rose on gold’s strength. YTD +29.7%. Investors like its uncorrelated returns in a portfolio and inflation hedge status. | | ETF (U.S.) | Utilities Select SPDR (XLU) | +2.5% | This ETF of U.S. utility stocks gained as interest rates dropped (making utility dividends more attractive) and recession fears boosted defensive sectors. Utilities typically have stable earnings in any economy. | | ETF (Canada) | iShares S&P/TSX Capped Utilities (XUT) | +2.0% | Mirrors the above trend for Canadian utilities (e.g., Fortis, Emera). Investors sought shelter in regulated power and gas distribution names with dependable dividends. | | Sector (TSX) | Consumer Staples | +1.0% | Staples was the only TSX sector positive in the recent rout. Names like Loblaw, Metro (grocers) and convenience store Alimentation Couche-Tard advanced on defensive positioning. | | Sector (S&P 500) | Health Care | +0.5% | While most S&P sectors fell, Health Care was flat-to-up. Big pharma (e.g., J&J, up 1%) and health insurers held steady – they have stable profits and some even benefit from lower interest (for insurers’ bond portfolios). | Data as of market close April 8, 2025. Past performance is not indicative of future results. These top performers illustrate a theme: defense wins in a shaky market. Assets perceived as safe – whether due to stable business models or hard assets like gold – saw buying interest amid the broader selloff. This doesn’t mean abandoning growth assets, but it reinforces why we always preach a balanced approach. | |
| | The Andex Chart – A Long-Term Investor’s Best Friend If there’s one chart every investor should see, it’s the Andex Chart. What is it? It’s a powerful visual that tracks the performance of $100 invested over ~70+ years across various asset classes (stocks, bonds, cash, etc.), overlaid with historical events. Essentially, it’s a timeline of market growth and world events in one chart. 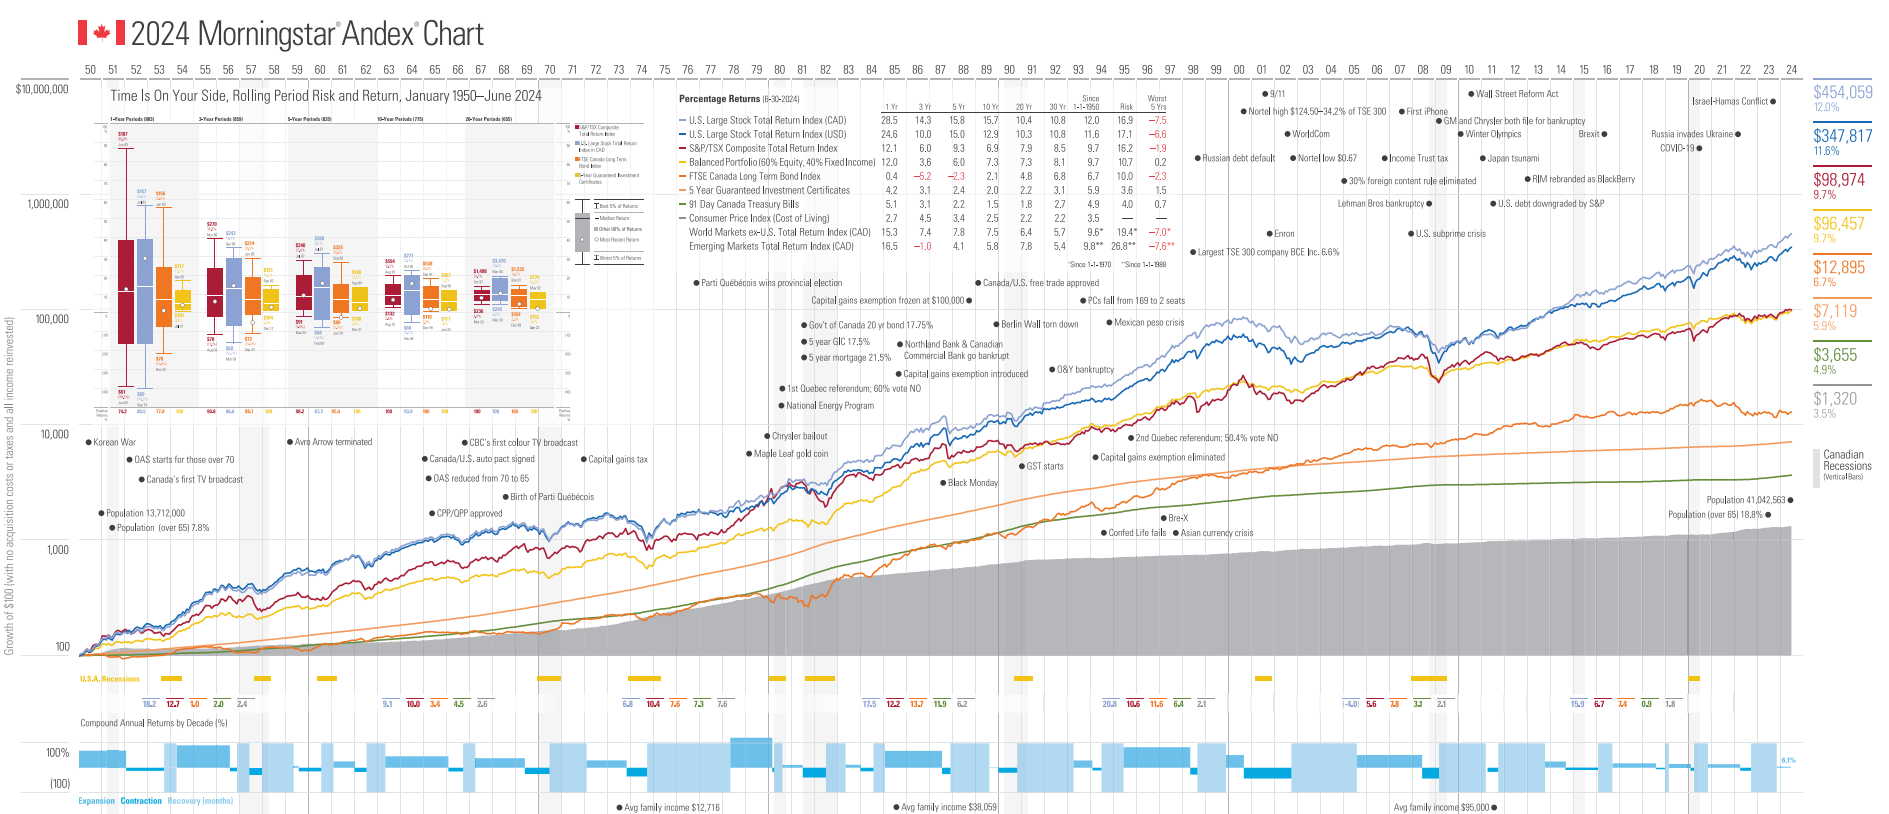
Why We Love the Andex Chart: - Long-Term Perspective: The Andex Chart vividly shows that despite wars, recessions, crises, and bear markets, the long-term trajectory of diversified investments is up. Each colored line (each asset class) trends higher over the decades. There are bumps along the way (e.g., 2008 stands out as a dip), but the recovery and subsequent growth dwarf those drops over time.
- Diversification in Action: Different asset classes perform differently under the same conditions. For example, during high inflation in the 1970s, gold surged while stocks languished; in the tech boom of the late 90s, stocks soared while bonds were steady. The Andex Chart underscores the importance of holding a mix – because when one zigged, another zagged, smoothing the ride.
- Context for Emotions: It’s common to feel fear during a crash or exuberance in a bubble. The Andex Chart helps ground us: it places current events in historical context. Seeing, say, “1987 Crash” or “2000 Dot-com Bust” on the chart alongside the ensuing recoveries helps remind us that “this too shall pass.” In other words, it helps investors avoid the pitfalls of panic selling or greedy buying by providing a cool-headed view.
- The Value of Staying Invested: Perhaps the biggest lesson: $100 invested decades ago grew to several thousand dollars today (exact amount depends on the period and mix, but all asset lines rise). Those who stayed the course reaped the rewards of compounding. The chart often notes that even after major declines, markets not only recovered but went on to new highs, rewarding those who didn’t sell out.
In practical terms, we use the Andex Chart in client meetings especially when discussing retirement planning or when markets are volatile. It’s a fantastic education tool to reinforce why having a long-term plan and sticking to it works. As one annotation on a recent Andex chart states: “It helps you consider current events through a long-term lens and, as a result, make informed investment decisions.” We couldn’t agree more. In times like now – with wild headlines – the Andex Chart is a comfort. It whispers: look how far we’ve come, and stay focused on the journey ahead, not the bumps underfoot. | |
| | Comprehensive Wealth Management Strategies – Using Insurance as an Investment Strategy Each week in this section, we spotlight a wealth strategy beyond stocks and bonds. This week: How to Use Insurance as an Investment Strategy, particularly for affluent investors. When we think of life insurance, the first thing that comes to mind is protection – a death benefit for loved ones. But permanent life insurance (like Whole or Universal Life) can also be a savvy investment and estate planning tool. Here’s how: - Tax-Advantaged Growth: In a permanent life policy, premiums fund not just the insurance cost but also a cash value account. This cash value grows tax-deferred. In fact, within certain limits, you can invest this cash value in sub-accounts (akin to mutual funds) or at a fixed rate. Over decades, the compounding can be significant, and you won’t pay tax on this growth as long as it stays in the policy. For high-net-worth individuals who may have maximized RRSPs and TFSAs, a life policy can act as an additional tax-sheltered investment account.
- Tax-Free Payout & Estate Benefits: The eventual death benefit is typically paid out tax-free to beneficiaries. This is huge for estate planning. For instance, say you have a $5 million estate largely in investments – that could incur taxes on capital gains at death. But an insurance policy can provide a tax-free lump sum to your heirs, offsetting those liabilities. It essentially preserves your estate. As one RBC Wealth article notes, for high-net-worth families, life insurance is “a critical tool when it comes to the tax burden for heirs.” In short, it can cover estate taxes, so your assets pass intact.
- Living Benefits – Access to Cash Value: Unlike term insurance which has no value unless you pass, permanent policies let you access the cash value while alive. You can usually withdraw or take a loan against the cash value. This can serve as an emergency fund or an opportunity fund. For example, in retirement, if markets are down, you could draw from your policy’s cash value (tax-free loan) to meet expenses, giving your portfolio time to recover. Or, if a business opportunity or real estate deal arises, you might borrow against the policy at a low interest rate. It’s like having a self-funded line of credit, with your policy as collateral.
- Enhancing Charitable Giving: Insurance can amplify philanthropy: purchase a life insurance policy with a charity as the beneficiary (or owner). Relatively small premium payments, leveraged over time, can create a large future gift. Meanwhile, premiums may qualify for charitable tax credits each year. It’s a way to leave a legacy far larger than you might by donating cash alone . Alternatively, you can make your estate the beneficiary and then direct the insurance payout to a donor-advised fund in your will, achieving similar philanthropic goals.
- Unique Asset Class in a Portfolio: Life insurance isn’t correlated to stock market returns. Whether markets go up or down, your policy’s cash value grows steadily (depending on the policy type, e.g., whole life often has a guaranteed minimum growth). This can provide stability in your overall net worth. In low interest rate environments, some policies even outperform GICs or bonds on a tax-adjusted basis. And in a high-rate environment, well, the guarantees can look attractive by comparison.
Important Considerations: We advise approaching this strategy carefully: - Ensure Insurance Need: It should start with an actual insurance need (income replacement, estate liquidity, etc.). The investment aspect is a bonus.
- Sufficient Cash Flow: Permanent policies require ongoing premiums which can be substantial. Make sure your cash flow can support it long-term so the policy doesn’t lapse.
- Policy Structure: Work with us (and insurance professionals) to design the policy properly – e.g., whether to maximize death benefit or cash value growth, whether to use loans vs. withdrawals for access, etc. There are advanced concepts like leveraging the policy (bank loans against it to invest elsewhere) which can enhance benefits but come with risk.
- Tax Rules: Insurance tax advantages are predicated on certain limits (MTAR limits in Canada) – basically ensuring it’s not just an investment account in disguise. We’ll navigate those to keep the policy tax-exempt.
Real-Life Example: Who: a couple in their 50s, with a successful business and substantial assets. Their goal: ensure their two children wouldn’t face a huge tax bill on inherited investment properties and stock gains, and also leave a charitable legacy. They implemented a $2 million joint-last-to-die whole life policy. They pay premiums from excess corporate earnings (tax-efficient use of funds). The death benefit will cover anticipated estate taxes, and whatever is left will go to their alma mater (they named the university as a co-beneficiary). Meanwhile, the policy’s cash value is growing; in 15 years they can borrow from it if needed to help fund a vacation home or other needs. This is comprehensive planning in action – insurance serving protection, investment, and legacy purposes all at once. In summary, insurance-as-investment isn’t for everyone, but for affluent investors with long-term outlooks and specific estate or tax planning needs, it can be a powerful, multi-faceted tool. It’s about thinking beyond the traditional boxes and leveraging all avenues to build and preserve wealth. If you’re curious whether this strategy might fit your situation, we’d be happy to discuss and provide a personalized analysis. Bottom Line: Despite a choppy start to spring in markets, we at Opheim Wealth Management remain focused on the long game. We continue to guide you with a steady hand through the current storms, always with an eye on opportunities that arise. As always, feel free to reach out with any questions about your portfolio or financial plan. We’re here to help you navigate the noise and stay on track to your goals. | |
| | About the Opheim Wealth Management Group Who We Are: The Opheim Wealth Management Group is a Saskatoon-based team within RBC Dominion Securities, dedicated to providing comprehensive wealth management for affluent and high-net-worth clients. Founded and led by Investment Advisor Josh Opheim, our team brings together a diverse range of skills – financial planning, investment management, and family legacy strategies – all under one roof. Our Services: We pride ourselves on managing “all aspects we can control beyond the market”. This means in addition to prudent investment advice, we delve into retirement planning, tax-efficient investing, estate planning, insurance solutions, and more. Whether it’s structuring a retirement income that lasts, funding a grandchild’s education, or planning a charitable legacy, we have the expertise to guide you. Our Values: As our motto states, Discipline, Dedication, Determination drive everything we do. Josh’s background as a professional athlete ingrained a commitment to excellence and preparation, which he’s carried into wealth management. We take a long-term, principled approach – no shortcuts, no fads. Our promise is to “leave no stone unturned” in pursuing our clients’ goals. We treat your wealth as if it were our own family’s, with precise, compassionate, and efficient service. Client Experience: Working with us means you get a trusted partner. We believe in clear communication – you’ll receive regular updates (like this publication), have regular strategy reviews, and access to our team whenever questions arise. We also engage the next generation, helping prepare your children or heirs for the responsibilities of wealth (our “Family Engagement” service). Ultimately, our success is measured by your peace of mind and the achievement of your financial aspirations. If you’re new to us – welcome! And to our long-time clients – thank you for your trust. We remain committed to earning it every day. Thank you for reading, and we look forward to speaking with you soon! 
| |
