
Even for seasoned investors, the market can seem pretty confusing and chaotic. Simply put, there are always uncertainties that markets need to reflect. The more uncertain the market “feels”, the more the market “looks confused”. This is reflected in the everyday price fluctuations, which is what some refer to as “risk”. The more risk-averse one is, the more one hates price fluctuations. This may be the reason why there is still an appetite for GIC’s, regardless of how low the interest rates are. Although 1-year GICs are currently paying less than 1%, investors are still purchasing them for the guaranteed income and principal protection. This is in spite of the fact that after inflation and taxes, they are receiving a negative return in terms of purchasing power.
Last year, in the midst of the pandemic, the market was uncertain when vaccines would be available, whether there would be a deep recession, and whether a long-term bear market would follow. All of these uncertainties created a big market correction of 38% from February to March. All of these uncertainties seemed to have abated this year, and the market is now focusing on a new set of uncertainties: whether high inflation will be persistent, whether Covid variants will renew the need for lockdowns, and whether market rotations between value and growth stocks will continue. Some investors have expressed the desire to wait and re-enter the market once it is calmer and more certain. Unfortunately, we feel this time will never come as the nature of the market is to fluctuate and reflect uncertainties.
Instead of constantly focusing on the noise from the market, I frequently tell my clients to look at the “big picture”. I mean this literally. Below are actual pictures of the stock market. These charts illustrate the historical patterns of the market. While one may not want to fully rely on historical charts to make future forecasts, they do provide perspective for long-term investors. Behind these charts are real people and all the participants in the market at that time. Their participation (buy/sell transactions) is amalgamated to create these trend lines. Human beings are creatures of habit. Emotions of fear and greed cause humans to manifest these emotions into market reactions which tend to repeat themselves over different cycles and through different generations of investors. People are generally fearful amidst uncertainty, which can create larger downward trends. On the other side of the coin, people are generally more confident amidst less uncertainty, leading to larger upward trends.
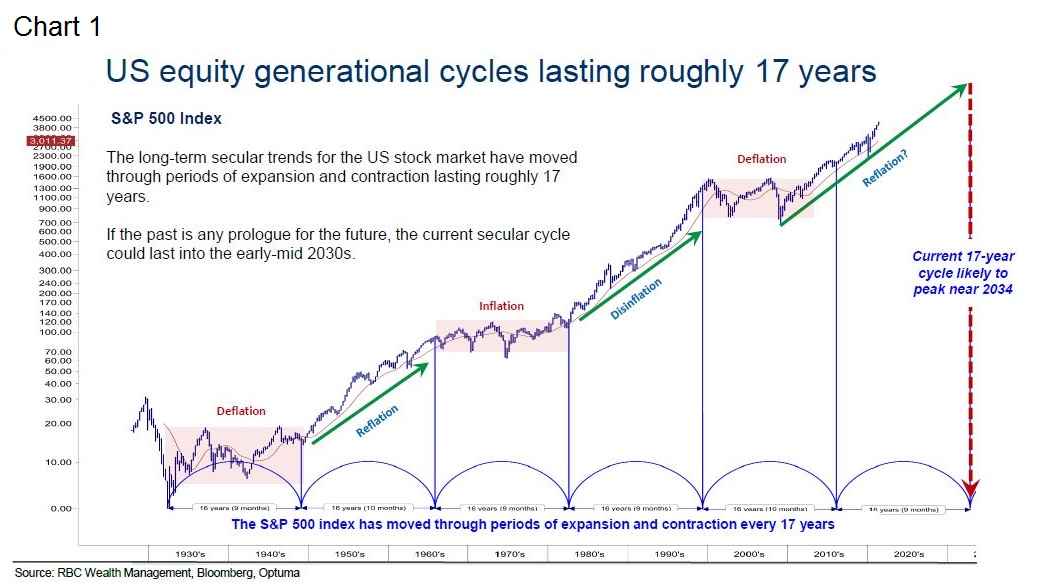
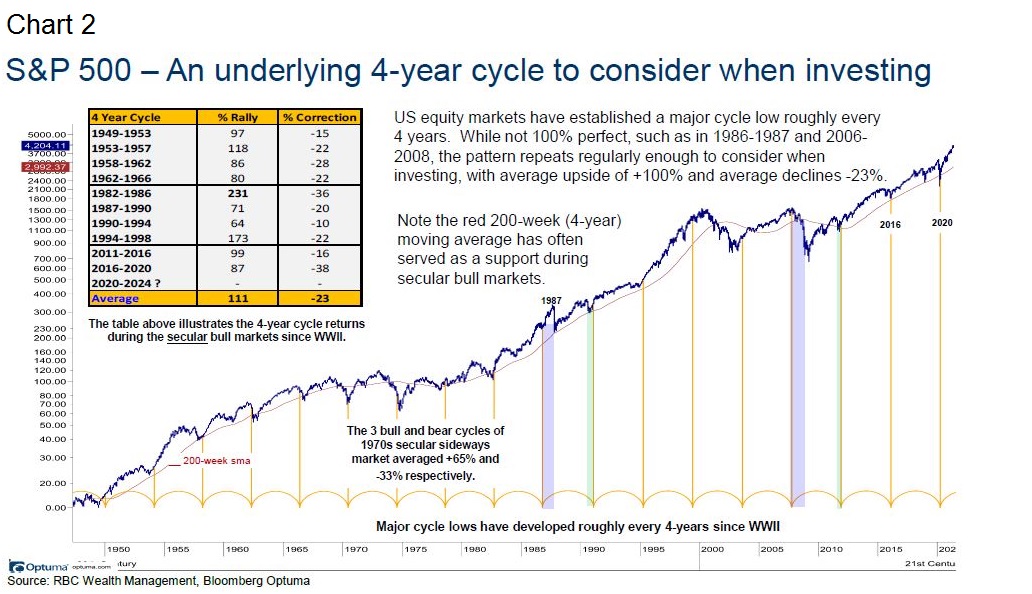
Currently, it looks like we are in the middle of a long-term upward trend (Chart 1). According to what investors have witnessed in the past, these long-term ‘secular’ trends tend to last for an average of 16-17 years. That said, we all recognize that markets do not go up in a straight line. Within the long-term trend, there are also short-term cyclical trends. These trends have lasted for an average of 4 years per cycle (Chart 2). Therefore, according to our firm’s technical analysis, we already experienced the last short-term correction back in 2020. While we may experience another short-term correction in the next few years, it seems like the long-term, secular upward trend is still intact. Hence, if you are a long-term investor, the market looks pretty good. If you want to manage (mitigate) the short-term volatility, then you may want to make more tactical moves in your portfolio. To find out how we can help, please check out my previous blogs:
"What If Your Advisor Can't Find You? - The PIM Discretionary Account".
“What If Your Advisor Can't Find You? - Custom solutions for different risk profiles”