
Over the last twelve months, clients have been asking for our input regarding personal real estate investments. We will outline our thoughts below.
It is certainly not atypical for investors to own additional property beyond their personal residences. We are proponents of diversification, therefore we believe investment real estate belongs in one’s overall wealth portfolio. However, as prices have fallen, what was once seen as a simple investment, now seems increasingly difficult to justify. Many properties are providing a negative cash flow, as rental incomes are devoured by the higher mortgage expense, taxes and fees. The main reasons for the price drops can be boiled down to the one-two punch of higher interest rates and unfavorable new government regulations. For some investors, fighting a government that appears fixated on making housing more affordable, seems like a contest they do not wish to enter.
At this moment, we are telling investors to track three macro charts and trends that influence real estate: A) Household Debt Levels B) Debt Servicing Costs C) Dollar Volume Trends.
Household Debt
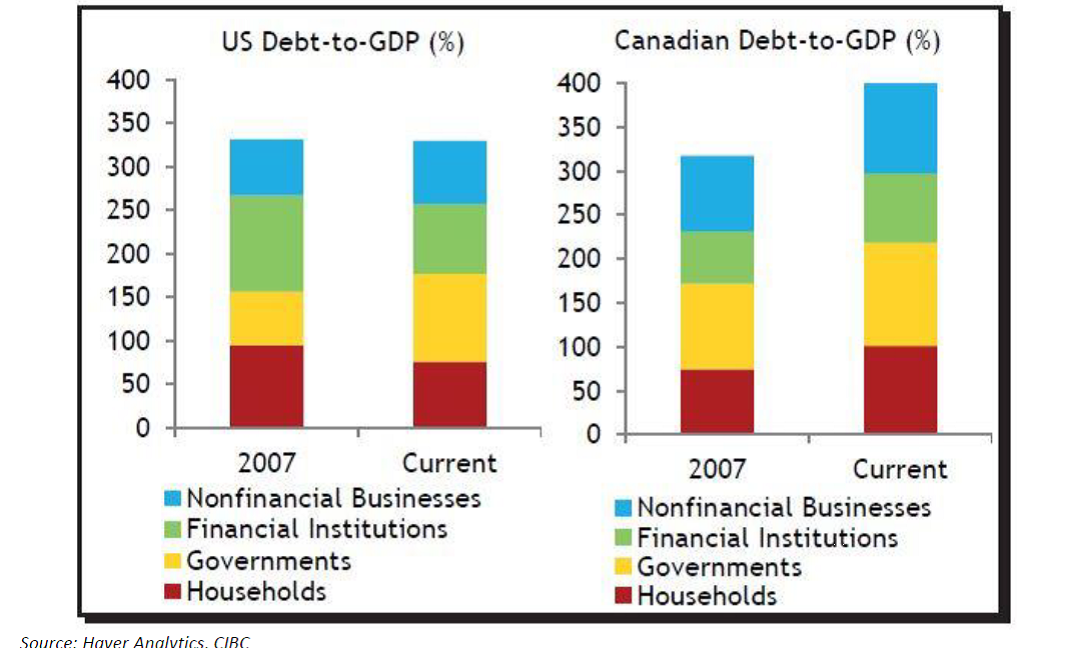
The amount of Canadian household debt relative to disposable income reached 178% in Q3 -2018. This is an eyebrow-raising number, when you consider that the number was 154% during the housing crisis of 2009. The increase in Canadian household debt levels matches what we have seen on the national Debt-to-GDP picture. As the chart below shows, Canada’s national debt levels currently surpass that of the US. Whereas our American neighbors have decreased their household debt (red bar), Canadians have increased theirs.
Debt Servicing Costs
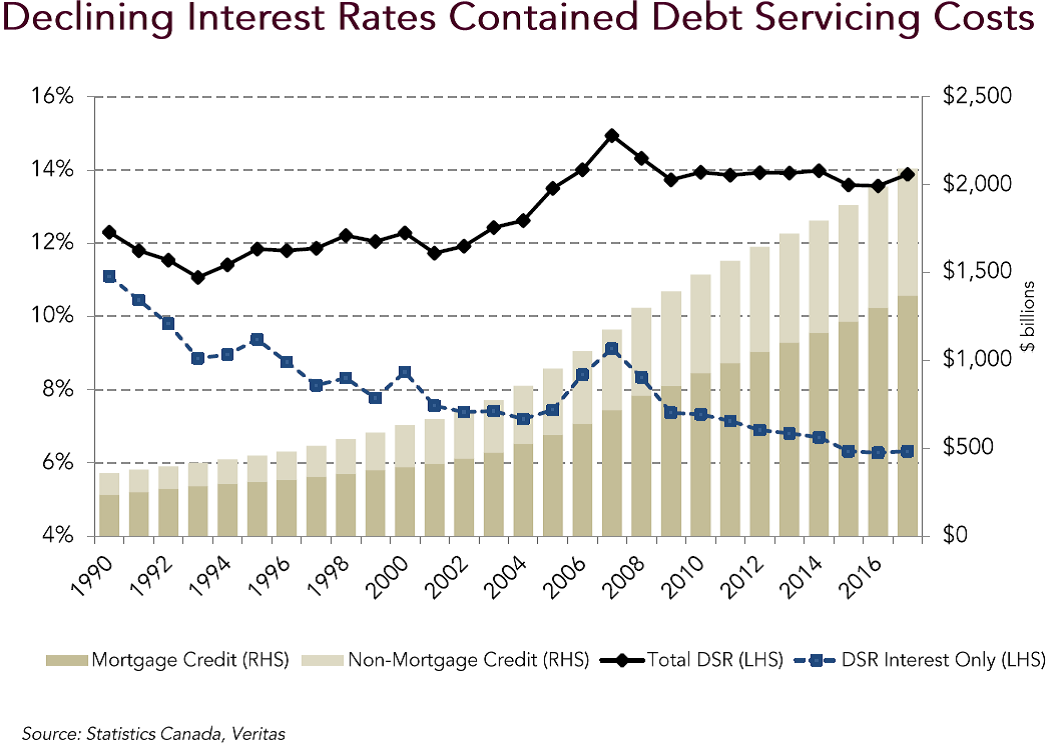
Although mortgage and non-mortgage debt has climbed steadily, it has not actually led the average Canadian to feel financial pressure. As the chart below shows, due to the government’s previous reductions in interest rates, the cost to service the increasing debt load has actually remained the same. Interestingly, for those who only pay interest costs (no principal reduction), their bill actually reduced. In other words, some Canadians took on more debt, and saw smaller monthly payments!
Dollar Volumes
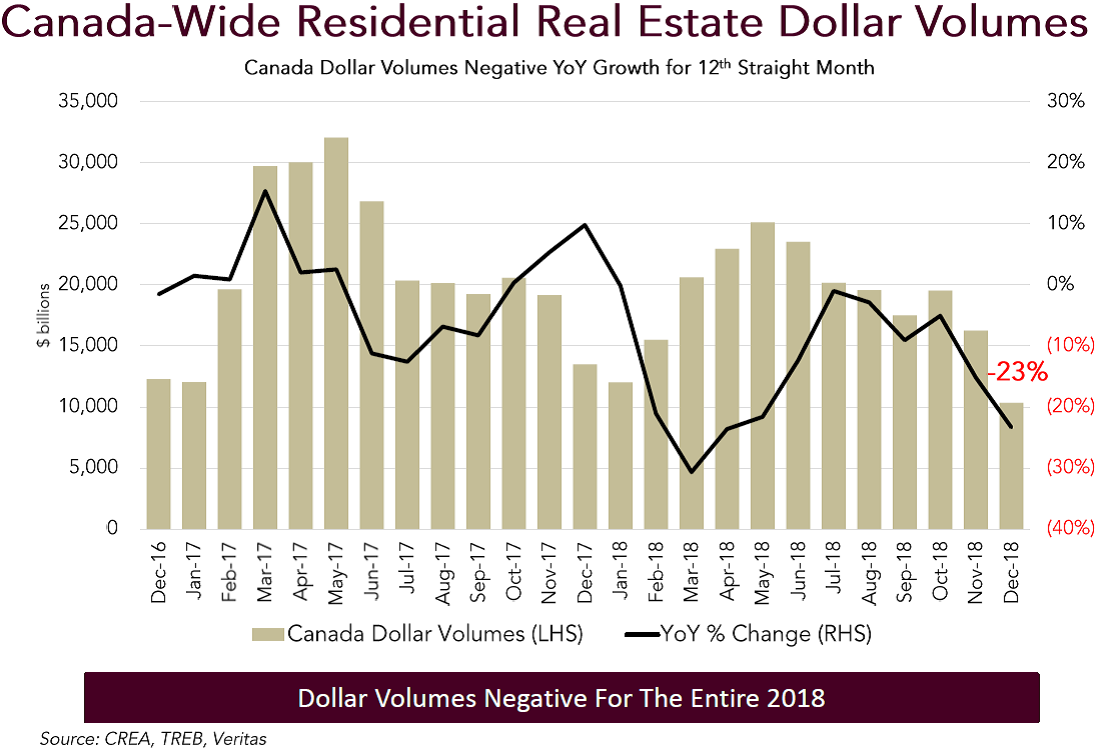
Canadian real estate dollar volumes were negative for the entire year of 2018. The country faced negative Year-over-Year Growth for twelve straight months, with the December 2018 data showing a drop of -23%. Depending on the city in which you invest, the magnitude differs, with Calgary at -20%, the Greater Toronto Area at -22%, and the Greater Vancouver Area at -49%.
Conclusion
Unfortunately, these variables do not point to a favorable backdrop for Canadian real estate investors. Sales volumes and prices will be vulnerable to an over-leveraged consumer and country that will find it increasingly difficult to borrow more. More importantly, Canadians should not expect to receive the artificial benefit of lower debt service costs brought on by an era of interest rate reductions.
Although personal experience can differ from the published national averages, and each property should be judged individually, we like to point out that the macro trend has been set. Similar to investing in the stock market, it can be tempting to rationalize the warning signs away by telling oneself that a particular property is special and can buck the trend. We recommend that investors review their current real estate exposure. If one decides to maintain an overweight to the asset class, we would recommend higher income paying and liquid alternatives that can be accessed through Real Estate Investment Trusts (REITs), many of which are priced at a discount to their net asset value.