
Markets often seem to sprint from one record to the next. When that happens, many investors start to hesitate. That uneasy feeling of buying at an all-time high is what some call a “psychological barrier to entry”. As prices break new records, it can feel like there’s nowhere to go but down – but that’s often not the case.
The hesitation to buy at all-time highs usually stems from one thing: trying to time the market. Investors who wait for the “perfect” moment hope to dodge the highs and buy in at the lows. The problem is, timing the market is nearly impossible to do consistently. And by avoiding times when markets are hitting new records, you could be missing out on years of potential growth.
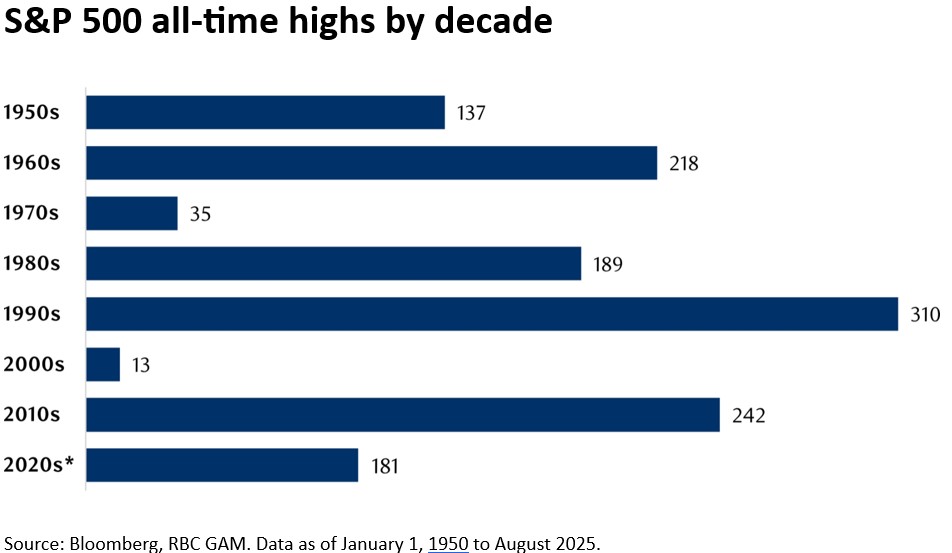
In fact, since 1950, the broad U.S. equity market has reached more than 1,325 all-time highs—an average of 17 records being broken every year. Avoiding every one of those would have meant sitting out a substantial portion of the market’s long-term progress.
What All-Time Highs Really Mean
All-time highs might sound dramatic, but they’re usually just a reflection of economic growth and stronger corporate earnings. Over the decades, innovation and productivity gains have continually pushed company profits—and markets—forward. While there are inevitable downturns, the long-term trend remains upward.
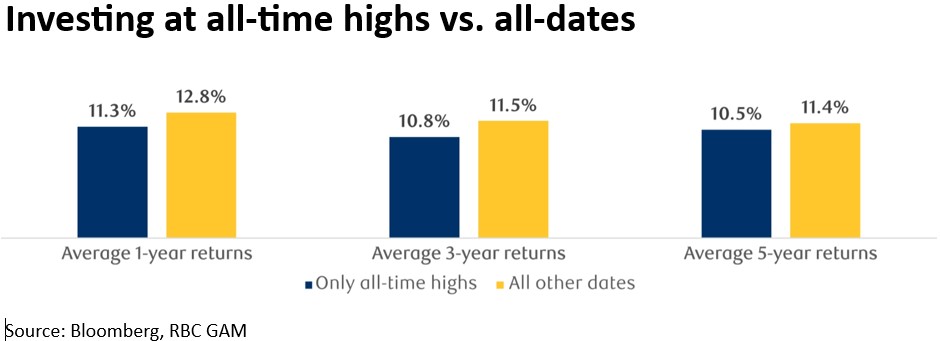
Here’s an interesting fact: if you only invested in the S&P 500 at all-time highs between 1950 and 2025 (what some might call the “worst” time to invest), your returns would have been similar to the average return of the index over one-, three-, and five-year periods. In other words, even if your timing was consistently “bad,” you likely still did quite well—simply by staying invested.
This period includes major market shocks like “Black Monday (1987)”, the “dot-com collapse”, and the “global financial crisis” of 2008. Despite all that, long-term investors have been rewarded for staying the course
The Myth of the Post-High Correction
It’s natural to wonder what happens after an all-time high. Many investors assume that a big correction must follow—but history tells a different story.
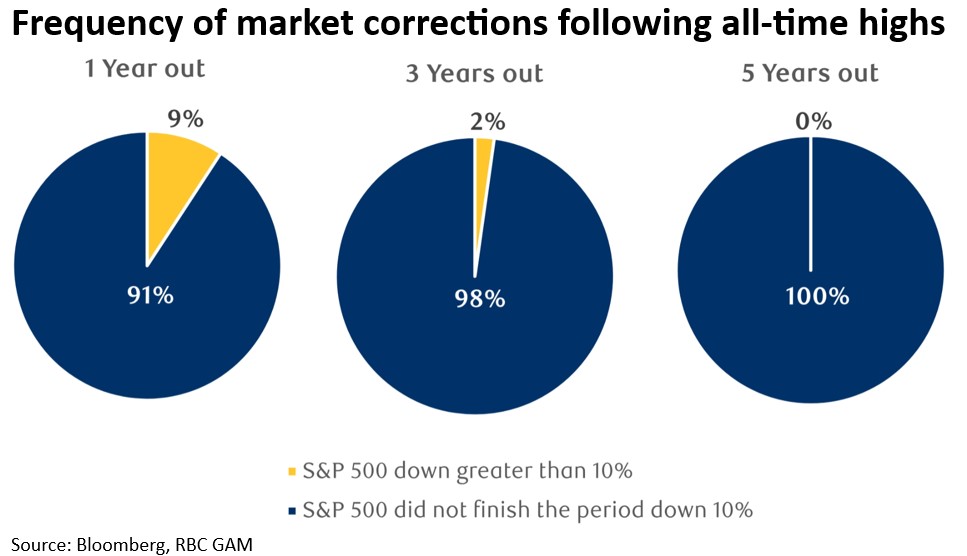
Data since 1950 shows that, looking one year out from each new S&P 500 high, a correction of more than 10% occurred only 9% of the time. Over a five-year period, the S&P 500 was never down more than 10% following any all-time high. That’s a striking statistic. It highlights how rare significant declines follow new market highs, especially over longer time frames.
The Value of Staying Invested
Key takeaways: New highs don’t necessarily mean markets are due for a drop—in fact, statistics have shown quite the opposite. All-time highs can signal that underlying fundamentals remain strong, and that growth is still underway. Instead of worrying about the timing of your investment, focus on the time you stay invested. History has shown that investors who remain patient and disciplined are the ones who tend to capture the market’s best opportunities.