
As we head into the second half of the year, the word ‘recession’ has been mentioned more frequently. It seems like a foregone conclusion that we are heading towards a recession, if not already in one. The recent inflation prints have been high, and the Fed’s interest rate hikes have been aggressive. Many believe that a government that continues raising interest rates into a softening economy will inherently lead to a greater chance of recession. We do not dispel that logic; however, the cross-currents of corporate fundamentals, consumer balance sheets, inflation expectations, Fed rate guidance, and stock valuations can dynamically change. Hence, we feel it more valuable to rely on a set of indicators that have historically been a good gauge of the imminence of a recession.
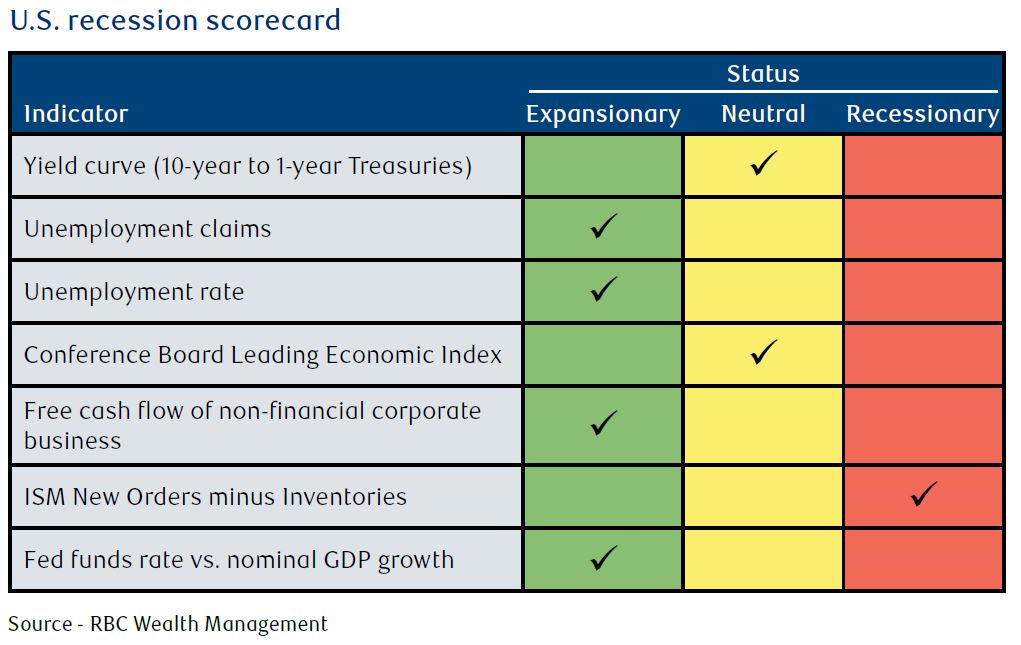
The U.S. recession scorecard is a tool that looks 6 to 12 months forward. The scorecard below indicates that the economy is still mostly in an expansionary stage. That said, one indicator, 'ISM New Orders minus Inventories' has entered Recessionary status and two indicators, the Yield Curve and the Conference Board Leading Economic Index, has shifted from ‘Expansionary’ to ‘Neutral.’ This implies that we are seeing incrementally higher recessionary risk.
It is important to dive into the indicators that have turned weaker. A negative reading for the ‘ISM New Orders minus Inventories’ would imply that consumers are not purchasing goods and inventories are building up. Many national retailers like Walmart, Best Buy and Target have reported in their earnings calls that they have too much inventory which carries a large expense to store. For that reason many news outlets have reported the possibility that retailers may consider processing refunds for returns but will forgo physically taking back the returned goods! Overall, when inventories are outstripping new orders, it suggests a weaker consumer, which usually signals the start of most U.S. recessions. However, this indicator has registered false positives in the past, as it only captures manufacturing activities, accounting for approximately 15% of the U.S. economy. Therefore, it does not offer the full picture of the economy. The information also comes from surveys rather than hard sales and inventory data.
The Yield Curve (10 Yr vs 1 Yr) has been one of the most reliable leading indicators of recession. When the yield of the 1 Year Treasury Bond is greater than the 10 Yr Treasury Bond, it implies that the markets view a greater near term risk to the economy and therefore commands a higher yield to compensate for that risk. Just a couple months ago the spread between the yields was comfortably wide at 85bps (ie. 0.85%). However, in recent days it has fallen to less than 10bps and could imminently fall below zero. Falling negative would trigger the recessionary signal with an average lead time of 11-13months.
The Conference Board Leading Economic Index signals a recession when it falls below the prior year’s print. When the indicator crosses that point, it has usually occurred 3-6 months prior to a recession. RBC Capital Markets feels that by the end of Q3, the LEI will face very tough comparisons as the index was quite high a year ago (Q32021) when many parts of the economy increasingly re-opened. Given that the indicator could be close to crossing lower, RBC has downgraded this indicator from ‘Expansion to Neutral’.
Overall, one should view this indicator in conjunction with other indicators that still point towards an expanding economy. For example, Free Cash flows from corporations are still extremely strong which signals that consumer demand is still healthy. Moreover, at the end of Q1, the nominal GDP growth rate stood at 10.6%. Albeit, should expectations of nominal GDP slow to 7% in 2022, or 5% for 2023, the economy should still be expanding higher relative to the level of interest rates. Ultimately, a scorecard that mostly points towards economic expansion can still be wrong. However, it is important to remember that the National Bureau of Economic Research (NBER) has the official responsibility of determining when a recession begins and when it ends. In our opinion, it may be difficult for NBER to declare a recession when employment is so strong. Last week, we received the June jobs data that showed a very strong labor market. Nonfarm payrolls increased 372,000 in one month, beating estimates of 250,000. Average hourly wages also increased 0.3% for the month and up 5.1% from a year ago. Overall, we will see what this recession will feel like as investors have never experienced a recession with unemployment at record lows of 3.6%. With continued hiring, it is fair to presume that businesses must still be seeing increased demand which should further support corporate earnings.
Reviewing RBC Wealth Management’s U.S. recession scorecard, we acknowledge that recessionary risk has increased. Careful and consistent monitoring needs to continue; however, as it stands, the firm’s chief strategist asserts that the overall economy remains in an expansionary stage. While the base case for many market participants is for a recession to be realized, the outcome of only a shallow or short-lived recession may allow for markets to recover faster than some may expect.