- The White House is keeping investors (and their adversaries) guessing as to the next steps in the most recent round of middle eastern hostilities.
- Smoke signals from the U.S. administration suggest they want this to end sooner rather than later, and markets are taking them at their word.
- Oil prices are elevated now, but prices for future delivery are much lower, while earnings estimates for U.S. stocks continue to rise.
- On balance, valuations have corrected more than stock prices, with the U.S. market now trading under 20x expected earnings.
- While not cheap, it is welcome relief from the elevated levels that prevailed in recent months.
- Investor sentiment has taken a hit, if not yet triggering the buy signal in our model. Most investors still have vivid memories of the 9.5% rally in the S&P 500 the day tariffs were deferred in 2025 and have no interest in being out of the market if the war ends quickly.
- In our view the outlook for markets hinges on a re-opening of the Straight of Hormuz. Investors have consistently shown indifference to foreign conflicts, but prolonged disruptions in energy supply are another matter.
As we near the one-month mark of the latest in a long line of middle-eastern conflicts, markets have thus far taken a fairly sanguine view of the duration and likely economic impact of the war. Make no mistake, there has certainly been a market reaction to the surge in oil prices and interest rates as markets price in the risk of higher gas prices and inflation. However, the degree of market correction and fundamental indicators we track suggest the market is largely taking the U.S. administration at its word that this will be a short conflict. While this administration has been predictably unpredictable, we see many indications that the over-riding desire is to put an end to the conflict and get oil moving through the Straight of Hormuz.
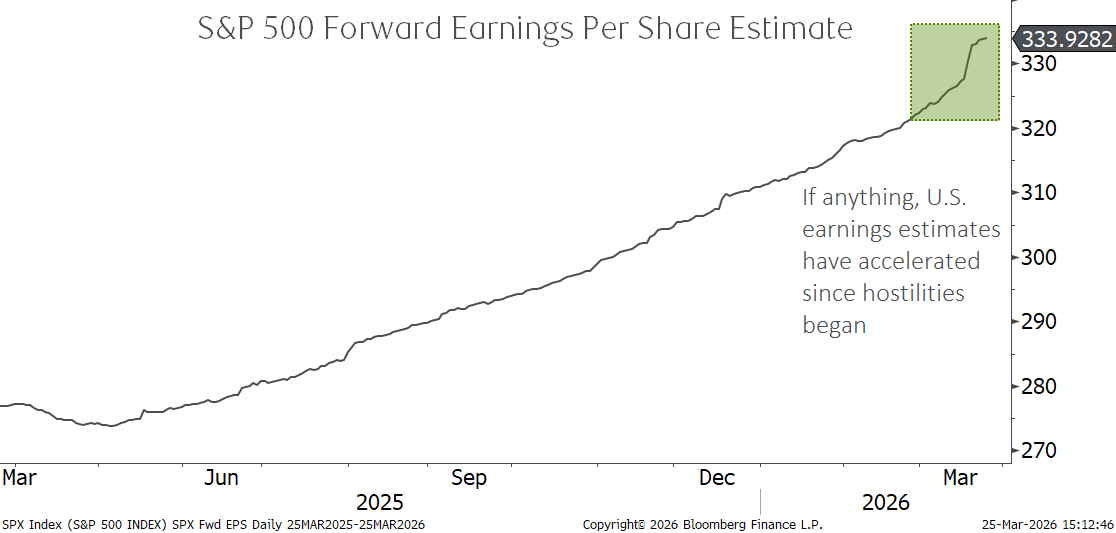
U.S. Earnings estimates are rising
The U.S. is now an energy exporter, and therefore the economy-wide impact of sustained $100 oil prices is much less than it has historically been. Economists estimate a 0.1%-0.2% hit to GDP this year should these prices hold, and S&P 500 earnings estimates continue to rise. The energy sector only makes up about 4% of the S&P 500, and while that sector’s earnings estimate has risen sharply, it is not a large enough weight to have a material impact on the index as a whole, suggesting other sectors are also seeing higher expected earnings growth. If industry analysts were girding for a consumer-led recession, we do not think overall S&P 500 earnings estimates would be rising. Note we are focusing on the U.S. here as the TSX has a much larger energy weight which is less representative of the global market or our portfolios as a whole.
Valuations have contracted
The combination of lower stock prices and still-rising earnings estimates means we have seen a healthy correction to valuations, measured by price-earnings ratios. From the peak P/E ratio of 23x seen in October of 2025, valuations are now down almost 15%, bringing us to valuations that prevailed shortly after “Liberation Day” in 2025. While just shy of 20x earnings is not necessarily “cheap”, we think it is much more reasonable and falls in the mid-range of valuations seen post COVID.

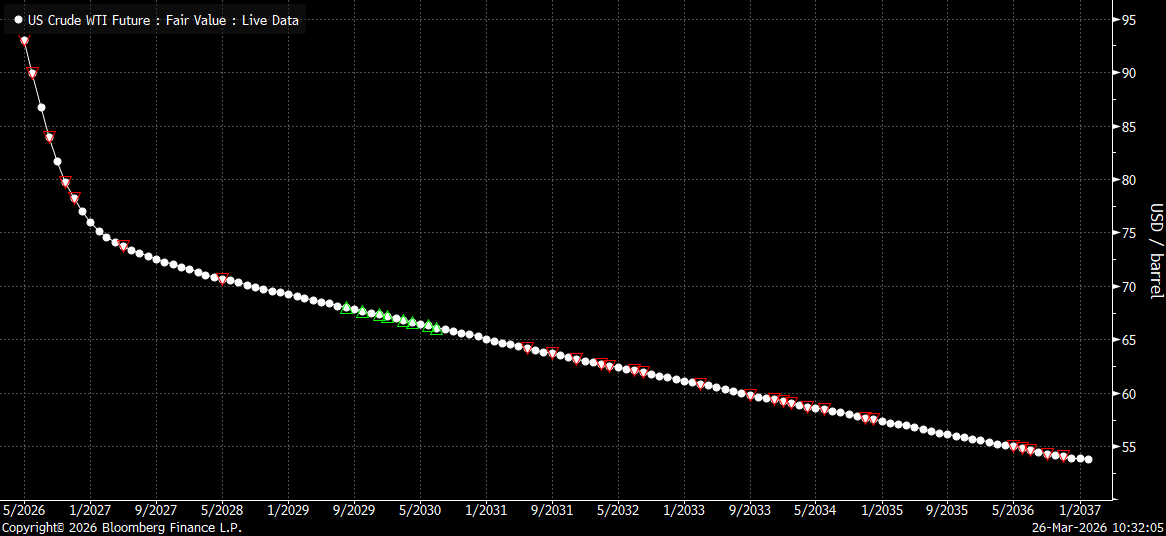
Crude oil prices are expected to fall
To us, this is the biggest indicator that markets are positioned for a short conflict. Oil prices are quoted based on the futures market. A futures contract price represents the price of oil for delivery at a point in time, with one contract per month. The price most typically quoted in the media is for the “front month”, or the closest upcoming date. Each dot in the chart below shows the market price for oil to be delivered each month into the future (hence “futures” market!) and this can tell us what markets think about the path of oil prices. Oil for delivery in May is trading at about $93 per barrel. Every month afterward, the price drops very sharply, so that oil to be delivered at year-end is at only $77 per barrel. If the market thought the conflict was to go on for many months, the decline in oil prices for future delivery would be much more muted.
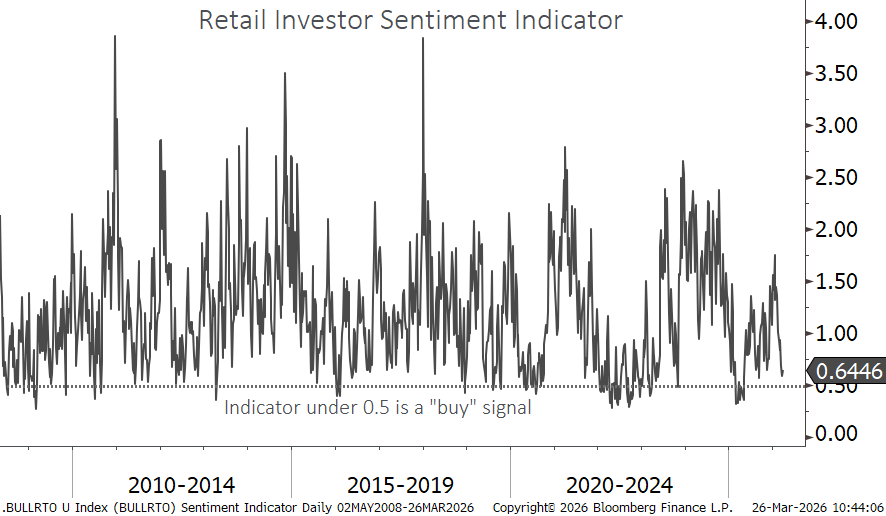
Investor sentiment down, but not despondent
Whenever we enter a short-term market correction, investor sentiment can be a reliable indicator for when the investing public has become too pessimistic. We have a developed an indicator that measures the sentiment of individual investors, and sure enough, it has deteriorated as volatility has picked up. We have not quite reached the historical buy signal of a 0.5 reading on the chart below, but it is pretty close. Our guess is sentiment would be worse if it weren’t for the sharp reversal around tariffs in 2025. The S&P 500 rose 9.5% the day the tariffs were deferred, and nobody wants to be caught out of the market if there is a quick conclusion to current hostilities in the middle east.
A narrow straight – wide impact
While the humanitarian cost of conflicts such as the one we are going through is always tragic, compassion has never been financial markets’ strong suit. Right now there is one question that matters – will oil flow through the Straight of Hormuz or not? Any indication that a resolution is near should see a strong positive market reaction, though not likely on the same scale as post-Liberation Day simply because the market reaction thus far has been more muted. If the straight remains closed and oil prices linger over $100 per barrel, we are likely to see increased pressure on consumers. We have lived with this level of oil prices for years post-Great Financial Crisis, but it is pretty clear the rate of change for the economy will soften should high oil prices persist. Holding a balanced portfolio of securities that can withstand multiple economic and market environments is always important, but it becomes non-negotiable when uncertainty reigns.
The Harbour Group
416-842-2300
Putting you first, every time, to help you navigate the complexities of managing your wealth. All of our team members, all of our resources, all of our collective insight: ALL FOR ONE: YOU™.
The information contained herein has been obtained from sources believed to be reliable at the time obtained but neither RBC Dominion Securities Inc. nor its employees, agents, or information suppliers can guarantee its accuracy or completeness. This report is not and under no circumstances is to be construed as an offer to sell or the solicitation of an offer to buy any securities. This report is furnished on the basis and understanding that neither RBC Dominion Securities Inc. nor its employees, agents, or information suppliers is to be under any responsibility or liability whatsoever in respect thereof. The inventories of RBC Dominion Securities Inc. may from time to time include securities mentioned herein. RBC Dominion Securities Inc. and its affiliates may have an investment banking or other relationship with some or all of the issuers mentioned herein and may trade in any of the securities mentioned herein either for their own account or the accounts of their customers. RBC Dominion Securities Inc. and its affiliates also may issue options on securities mentioned herein and may trade in options issued by others. Accordingly, RBC Dominion Securities Inc. or its affiliates may at any time have a long or short position in any such security or option thereon. Mutual funds are sold by RBC Dominion Securities Inc. There may be commissions, trailing commissions, management fees and expenses associated with mutual fund investments. Read the prospectus before investing. Mutual funds are not guaranteed, their values change frequently and past performance may not be repeated. RBC Dominion Securities Inc.* and Royal Bank of Canada are separate corporate entities which are affiliated. *Member CIPF. ®Registered Trademark of Royal Bank of Canada. Used under licence. RBC Dominion Securities is a registered trademark of Royal Bank of Canada. Used under licence. ©Copyright 2019. All rights reserved.