- The summer of 2025 has been good to investors, but we have now entered what is historically the most challenging month for the TSX and S&P 500.
- There are various theories, but for whatever the reason, September has a well-earned reputation for throwing investors curve balls, with a long term average negative return in both Canada and the U.S.
- This is not as ominous as it sounds, as the probability of a negative return is little worse than a coin flip.
- As we approach the turn in the calendar, statistically speaking things turn for the better, with November and December historically among the strongest months of the year.
- Seasonal factors are essentially the definition of “typical” volatility and given the historical prevalence shouldn’t be something that surprises us or strikes fear, but suggests we should be ready to capitalize on opportunities that present themselves.
Fall volatility has become a market tradition…
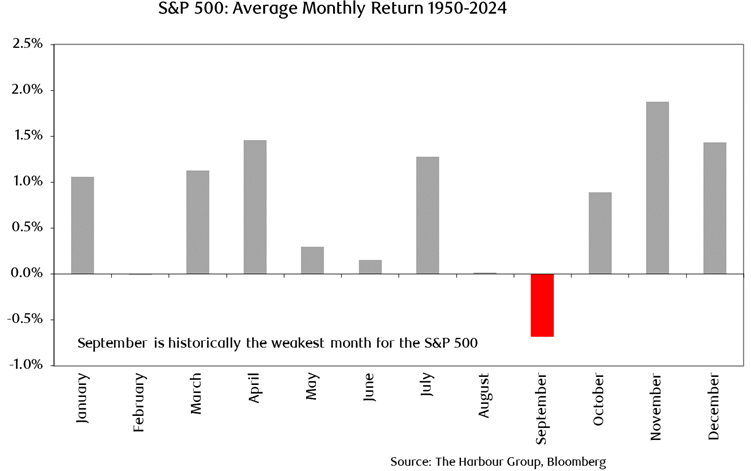
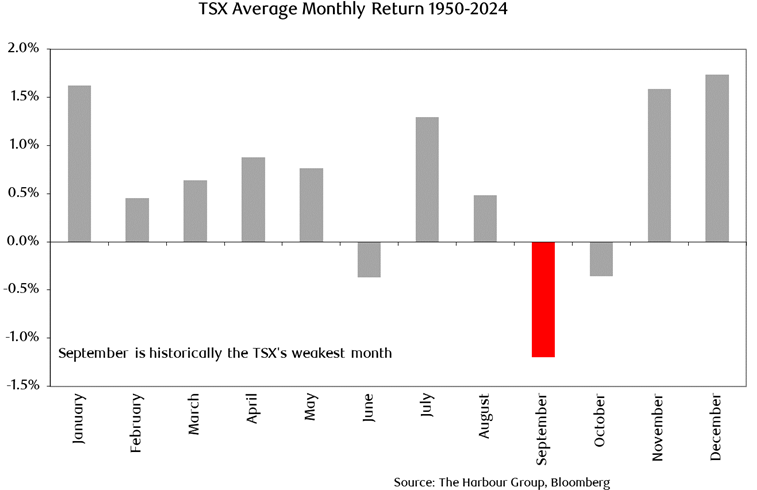
For anyone who has been involved in markets for any significant amount of time, the so-called “seasonal effect” on markets is well known. For reasons that no-one can seem to pinpoint, equity markets have historically seen elevated volatility in the autumn, and September in particular. As seen below, both the S&P 500 and TSX have seen on average negative returns in September in data going back 75 years!
…but nobody really seems to know why
Many different hypotheses have been presented to explain this phenomenon, including a lack of corporate news after the summer earnings season, investors coming back from holiday and adjusting their portfolios, and the start of tax-loss selling season among others. Whatever the reason, this phenomenon has existed for some time and therefore none of us should be surprised if volatility picks up once again. After all, we typically go through one or two corrections of the 5-10% variety every year, in what we call the price of admission for earning equity market returns.
In reality, odds of losing money in September a little worse than a coin flip
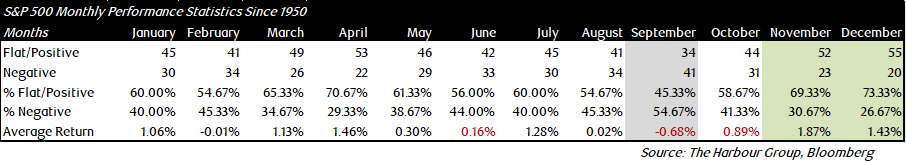
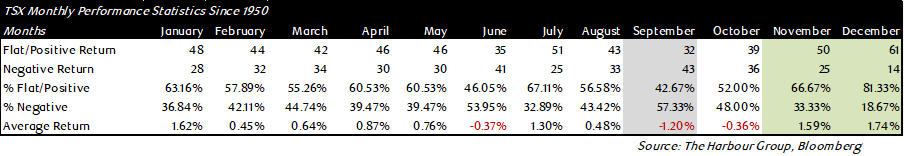
The charts above may look concerning, but if we look at the actual numbers in the chart they show an average 0.68% loss for the S&P 500 and a -1.2% for the TSX. For a portfolio split 50/50 between these two markets that adds up to an average decline of less than 1%, which frankly is something that can happen to an equity portfolio on any given day. The historical odds of a negative September are 55% and 57% in the U.S. and Canada, respectively, so this is by no means a foregone conclusion!
No rain, no flowers
Sometimes we have to go through a bit of discomfort to get to a better place, as anyone re-engaging with an exercise regime will tell you! The same goes with investing. While markets have a habit of testing our patience in the fall, we are often rewarded once the snow starts to fly. Once again, for reasons no one can pinpoint, both U.S. and Canadian equity markets have seen statistically strong and reliable performance in November and December, with these two months on average contributing more than 1/3 of the average annual return. This is further backed up by a “batting average” which sees positive returns 2/3 of the time for both months on both sides of the border.
We present this data not to incite fear or breed excitement, but simply to say that twists and turns in markets are to be expected, even if they feel unexpected after long periods of calm. In our view, the well-prepared and informed investor is best suited to weather market volatility and stick to their long term plan. This is easier said than done, but in our experience these simple actions (or lack thereof!) vastly increase the odds of long-term investment success.
The Harbour Group
416-842-2300
Putting you first, every time, to help you navigate the complexities of managing your wealth. All of our team members, all of our resources, all of our collective insight: ALL FOR ONE: YOU™.
The information contained herein has been obtained from sources believed to be reliable at the time obtained but neither RBC Dominion Securities Inc. nor its employees, agents, or information suppliers can guarantee its accuracy or completeness. This report is not and under no circumstances is to be construed as an offer to sell or the solicitation of an offer to buy any securities. This report is furnished on the basis and understanding that neither RBC Dominion Securities Inc. nor its employees, agents, or information suppliers is to be under any responsibility or liability whatsoever in respect thereof. The inventories of RBC Dominion Securities Inc. may from time to time include securities mentioned herein. RBC Dominion Securities Inc. and its affiliates may have an investment banking or other relationship with some or all of the issuers mentioned herein and may trade in any of the securities mentioned herein either for their own account or the accounts of their customers. RBC Dominion Securities Inc. and its affiliates also may issue options on securities mentioned herein and may trade in options issued by others. Accordingly, RBC Dominion Securities Inc. or its affiliates may at any time have a long or short position in any such security or option thereon. Mutual funds are sold by RBC Dominion Securities Inc. There may be commissions, trailing commissions, management fees and expenses associated with mutual fund investments. Read the prospectus before investing. Mutual funds are not guaranteed, their values change frequently and past performance may not be repeated. RBC Dominion Securities Inc.* and Royal Bank of Canada are separate corporate entities which are affiliated. *Member CIPF. ®Registered Trademark of Royal Bank of Canada. Used under licence. RBC Dominion Securities is a registered trademark of Royal Bank of Canada. Used under licence. ©Copyright 2019. All rights reserved.