- As investors approach retirement, we are often met with questions about asset allocation, specifically around increasing fixed income allocations.
- This is a natural inclination, as once we are past our earning years it becomes more difficult to recover from losses and we lose the benefit of strategies such as dollar cost averaging.
- The “4% rule” has been commonly used for decades as a jumping off point for determining an appropriate withdrawal rate.
- Our view has always been that the appropriate amount of risk reduction is typically much less than people think as most retirees have time horizons stretching past 25 years.
- Research from our colleagues at RBC Global Asset Management has put some numbers behind this intuition, suggesting a portfolio of 100% equities is actually safer than cash if risk is defined as outliving your money.
- The “safest” allocation turns out to be a typical growth-oriented asset allocation of 75% stocks and 25% bonds.
Determining an appropriate spending rate is one of the biggest challenges for new retirees. Spend too much, and one risks running out of money, severely tarnishing what should be the “golden years”. Those that spend less may find out that they could have retired earlier or dedicated more funds toward consumption when they were younger. Without perfect foresight around market returns, health span and life expectancy there is of course no right answer.
“4% rule” has defined retirement planning for decades…
30 years ago the Journal of Financial Planning published an article by William Bengen that suggested a 4% withdrawal rate, adjusted for inflation after the initial year, was a “safe” withdrawal rate for someone holding a portfolio of 50% U.S. stocks and 50% bonds. This “4% rule” has over the years become gospel in the world of financial planning. In a recent paper, our colleagues at RBC Global Asset management looked to update this thesis for the current day and in doing so they draw some interesting conclusions regarding the optimal asset allocation for retirement.
… and it still holds true today
The authors have updated the methodology slightly, using a 60% stocks/40% bonds portfolio instead of 50/50, but the results are the same – the 4% rule has stood the test of time. In the charts below you will see terms such as median and percentile used. For those of us without a statistics background, the median is the result in the middle of a dataset, i.e. half of observations fall above and half below. Percentile is similar, and refers to the number of observations that fall below that number. i.e. for the 5th percentile, 5% of observations fall below this number, and for the 95th percentile, 95% of results are below. In the dataset below, we think of the 5th and 95th percentile readings as near (but not absolute) worst and best case scenarios.
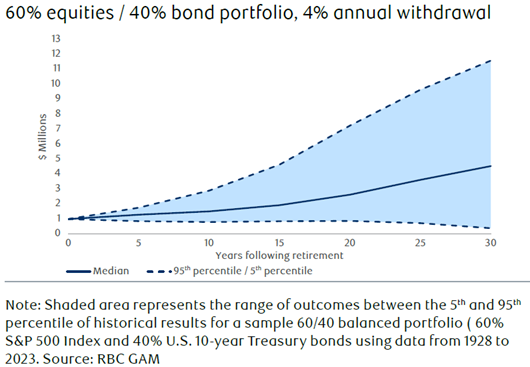
Most of the time, the portfolio actually grows…
The example below shows the value of a 60/40 portfolio that starts with $1MM and distributes $40,000 in the first year, adjusted for inflation thereafter. While there is a wide distribution of outcomes depending on retirement start date, 95% of the time the portfolio does not run out of money, and in the near-best case scenario it actually grows to north of $10MM and half of the time it was worth $4MM or more.
Value of a sample retirement portfolio: all experiences
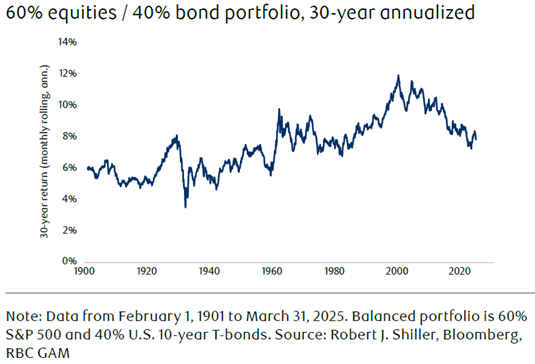
…as historical returns have typically well-exceeded 4%
The results above may seem somewhat difficult to believe, but they make more sense when we look at historical 30-year rolling annualized rates of return (each plot on the graph is a lookback at a 30-year annualized return) , which have often averaged well above 4%.
History of balanced portfolio returns
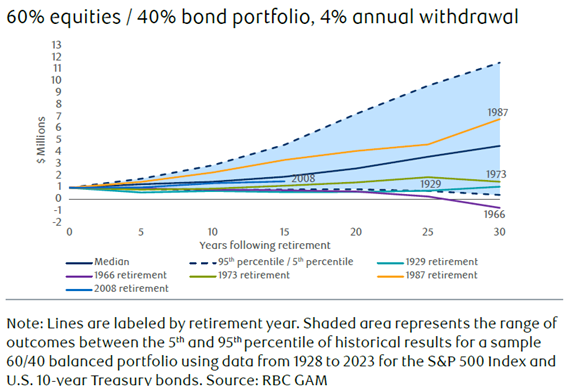
What if one has extraordinarily bad luck?
As mentioned above, the 5th/95th percentiles are the nearly worst case/best case scenarios. What if you have the misfortune of retiring in a rerun of 1966, the worst year in the dataset to have retired? In that scenario, the investor did indeed run out of money after 25 years, but notably other very bad times such as 1929, 1973, 1987 and 2008 (so far) ended with money left over after 30 years of withdrawals.
Sample retirement portfolio for selected “worst case” dates
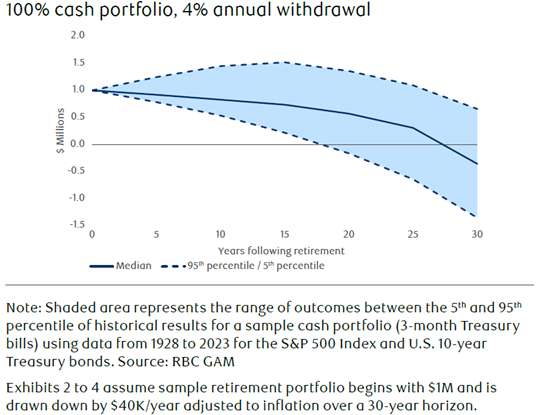
Going to cash has historically not worked well
The natural inclination of many investors is to reduce risk materially upon retirement and that logic is understandable – one’s ability to make up losses or add to the portfolio is sharply diminished without employment income. The starkest example of this would be going to cash. In the median outcome using 95 years of data, one runs out of money after about 27 years, and much sooner in the near worst case scenario.
Value of sample retirement portfolio
Long retirement time horizons favour stocks
When asked about changing asset allocation around retirement our inclination has typically been that people will be better served with more equity than they may think because the typical retirement these days can be 25 years or more. That allows ample time to absorb the occasional hits from volatility and allows significant time to take advantage of compounding. The table below looks at different asset allocations along with the ending value of a $1MM portfolio with a beginning $40,000 withdrawal rate after 30 years, along with the probability of success/failure (i.e. running out of money). As seen below, an all-cash or bond-heavy asset allocation has historically had an uncomfortably low probability of success. Taking equities to a majority weighting and higher are the only scenarios that have probabilities of success that easily exceed 90%. Indeed, a 100% equity allocation has historically been much “safer” than cash and majority-bond portfolios.

So – what is the right asset allocation?
Like so many decision in personal finance, the “right” asset allocation is going to be heavily influenced by risk tolerance and behavioral economics. While a 100% stock asset allocation has a very high probability of success and has the potential to leave a substantial estate (or increased spending in later years) it is important to note this analysis assumes the portfolio remains invested. These numbers do not take into account material downward changes in equity allocation in the depths of steep market corrections and the damage that typically does to long-term returns. Our experience suggests most investors don’t have the stomach for 100% equities, especially in the absence of a steady cadence of contributions to the portfolio. What these numbers do show, however is that in order to have a very high probably of success at a starting 4% withdrawal rate, a healthy allocation to equities will be required if the future looks anything like the past.
The Harbour Group
416-842-2300
Putting you first, every time, to help you navigate the complexities of managing your wealth. All of our team members, all of our resources, all of our collective insight: ALL FOR ONE: YOU™.
The information contained herein has been obtained from sources believed to be reliable at the time obtained but neither RBC Dominion Securities Inc. nor its employees, agents, or information suppliers can guarantee its accuracy or completeness. This report is not and under no circumstances is to be construed as an offer to sell or the solicitation of an offer to buy any securities. This report is furnished on the basis and understanding that neither RBC Dominion Securities Inc. nor its employees, agents, or information suppliers is to be under any responsibility or liability whatsoever in respect thereof. The inventories of RBC Dominion Securities Inc. may from time to time include securities mentioned herein. RBC Dominion Securities Inc. and its affiliates may have an investment banking or other relationship with some or all of the issuers mentioned herein and may trade in any of the securities mentioned herein either for their own account or the accounts of their customers. RBC Dominion Securities Inc. and its affiliates also may issue options on securities mentioned herein and may trade in options issued by others. Accordingly, RBC Dominion Securities Inc. or its affiliates may at any time have a long or short position in any such security or option thereon. Mutual funds are sold by RBC Dominion Securities Inc. There may be commissions, trailing commissions, management fees and expenses associated with mutual fund investments. Read the prospectus before investing. Mutual funds are not guaranteed, their values change frequently and past performance may not be repeated. RBC Dominion Securities Inc.* and Royal Bank of Canada are separate corporate entities which are affiliated. *Member CIPF. ®Registered Trademark of Royal Bank of Canada. Used under licence. RBC Dominion Securities is a registered trademark of Royal Bank of Canada. Used under licence. ©Copyright 2019. All rights reserved.