

Investors generally tend to be skeptical when it comes to “all-time highs” in the stock markets. However, the chart below should give perspective to remind us that record highs have been common since the 1950’s, with an average of 16 per year.

Source: RBC GAM, Bloomberg. Data as of November 7, 2019
As an investor, these “all-time highs” can seem to bring on additional risk of market correction, when actually they should bring an understanding that market highs are more common than one thinks. While there is always risk with investing, cash has only one outcome – extreme stability. The very minimal return of cash enhances your risk of missing market returns. To illustrate, the chart below shows on average, even when you invest in high markets, you still earn nearly the equivalent returns compared to average rolling returns during the same period.
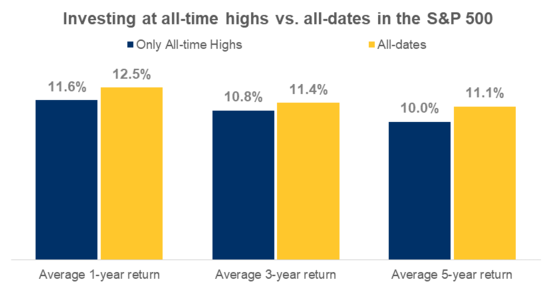
As these charts demonstrate, returns are still to be made during market highs. When looking at market outlook and the record levels reached this week, investors should focus on these key highlights.
- Market highs seem to suggest China and the U.S. have agreed to both lift certain tariffs if both sides can finalize the “Phase 1” trade deal.
- Despite slowing profit growth, analysts believe earnings growth will rebound to continue strong profits.
- For 108 consecutive months, the U.S. has continued its steady growth to add jobs and display a strong labour market. Job growth in the U.S. suggests the economy may be in a better condition than many believe.
- Any lowering of trade barriers (tariffs) is positive for the global economy.
Enjoy the rest of your week,
Sam McLaughlin