Given the high and rising levels of debt in the U.S. economy (due largely to an expanding Federal balance sheet), we field frequent questions about what the future implications associated with all this debt could be. Total U.S. debt outstanding, which includes household debt, corporate debt and Federal debt shouldn't be as worrisome as one might think, but shouldn't be ignored, either.
Before I get into the numbers, keep in mind that the US economy is unique in its position as the center of global exchange. As a consequence, the U.S. can sustain a much higher debt level than most advanced economies, though there are, of course, limits.
Total US Debt Outstanding in the US: 1981-2014

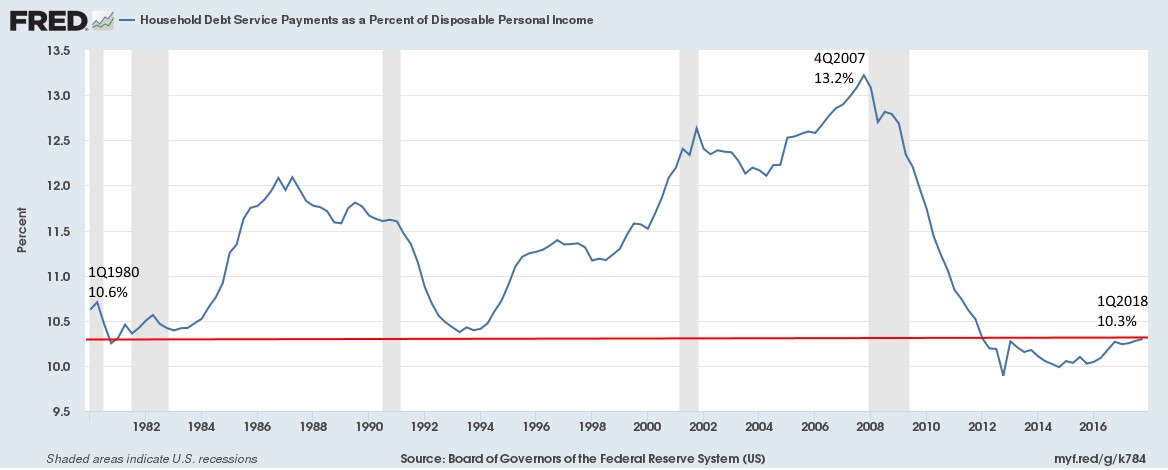
As the chart above shows, the three largest categories of U.S. debt outstanding include Federal, Business and Household debt. Because of the damage that it caused during the last financial crisis, household debt has become a main topic of discussion this time around. Keep in mind: consumer spending makes up nearly 70% of total U.S. GDP—the ability to continue to spend is vitally important. Household debt allows a lot of this spending (we love to buy things on credit, and our American brethren do, too). And that debt has actually fallen since the aftermath of the 2008 recession. In fact, household debt per capita is actually now at the same level it was during the early bull market of 2002. Household interest coverage has remained stable around 10% of disposable income, which is about the same as it was in the early 80’s, 90’s and 2013.
Ease of Servicing Household Debt
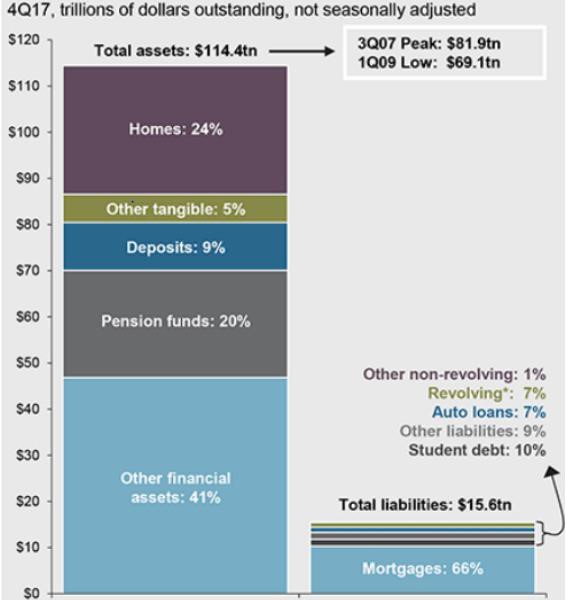
Household assets have also seen an increase in recent years. As of Q4 2017, household assets are almost seven times larger than total liabilities. In layman’s terms, if all of the household debt in the U.S. had to be paid off overnight, American’s have seven times more stuff to sell than they’d need to cover all the debt (see the chart below). The current multi-decade low in consumer leverage actually makes it look like we’re in the early stages of an economic expansion.
The Consumer Balance Sheet
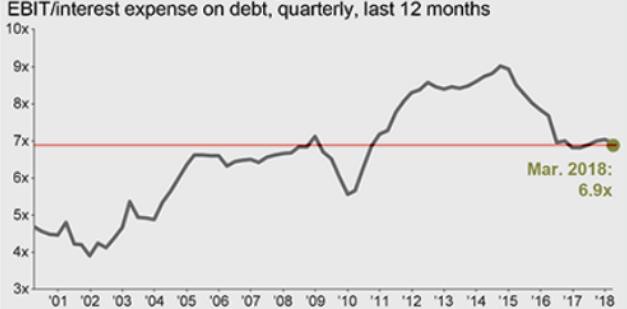
The picture isn’t that much different on the corporate debt side. The delinquency rate on corporate loans is currently lower than at any time during the last three expansion cycles. Even credit spreads (the rate difference in loans between ‘good’ and ‘bad’ credit companies) remain near record lows and default rates are below normal amounts. Net corporate leverage has seen little change compared to ten- and twenty- years ago and interest coverage is better than any of those years. Companies in the S&P 500 can pay their interest costs seven times over with earnings; a better cushion than any point in time during the 80s & 90s.
S&P 500 Companies Interest Coverage Ratio
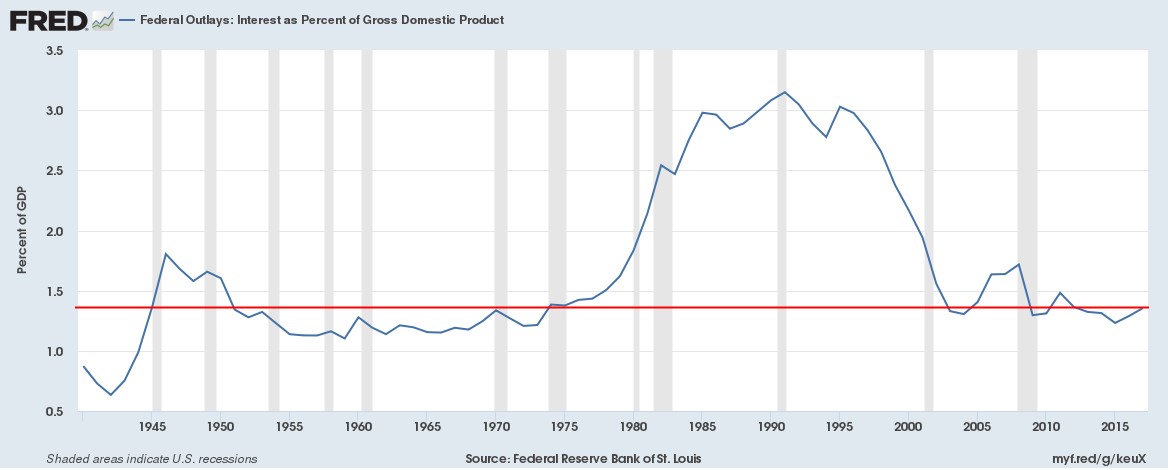
Lastly, even though the U.S. Federal debt will expand further, there is no substantial evidence that suggests Federal debt on its own is a risk to future growth. First the positive thesis and an example: debt, in theory, pulls growth forward because the debt will eventually have to be paid. Japan has the highest federal debt-to-GDP ratio in the developed world and crossed the 100% GDP threshold in 1996; they then saw 11% growth in the next decade. Right now, the U.S. government can borrow for ten years at a 0.7% real interest rate. Real GDP growth in comparison was 2.8% year-over-year. Human nature is to prefer debt levels to be lower as it provides greater flexibility for future growth, but there is a strong argument that Federal debt at this time is more than manageable. If you could borrow for next-to-free for ten years and pile it into your business (or a portfolio of stocks), you’d almost be silly not to. Especially if you could just print more money at any time if you needed it.
US Federal Debt as a Percentage of GDP
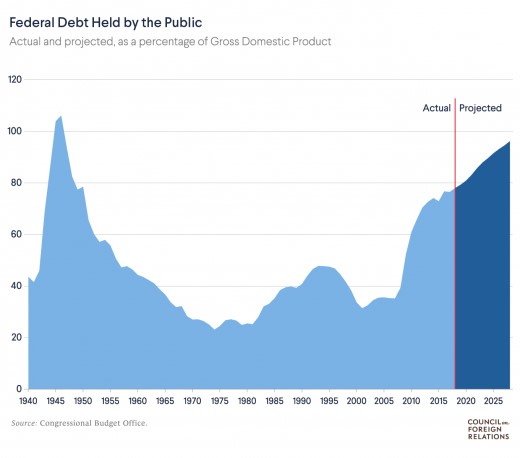
There is a negative thesis, however, and one to watch out for as an investor. Even though the U.S. can borrow at these rates and be just fine, doing so has other long-term effects, not all of which are good for investors of any stripe. Higher debt levels typically are not good for a country’s currency. If a Canadian investor buys shares in a U.S. company or a U.S. bond and the U.S. dollar drops, the Canadian could see negative returns in Canadian dollars. Additionally, even though the U.S. has the ability to easily shoulder an even higher debt burden than current, the political will to actually continue to raise the debt ceiling might not be there. Donald Trump ran on the accusation that Obama doubled the national debt [which he did, arguably staving off a Depression] and that he would reverse it [he is so far doing the opposite, during an economic expansion]. The most salient representation of this is Congress’ perennial threat to not raise the “debt ceiling.” If investors start to deem these threats credible, it’s entirely possible that the credit rating agencies (Moody’s, S&P, etc.) could lower their credit rating on the U.S. debt, which could have a major impact on global markets as a whole.
Federal Debt Held by the Public as a Percentage of GDP
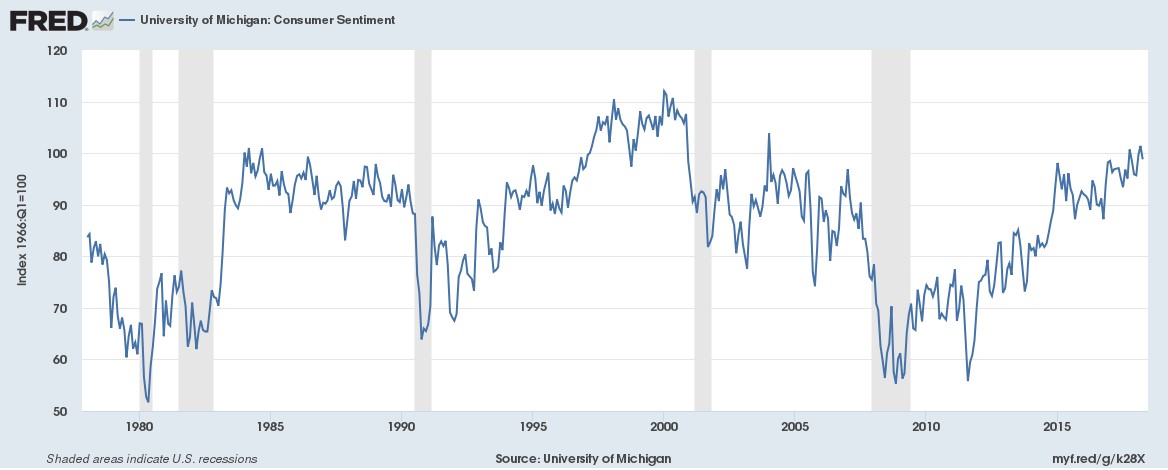
The action going forward is to watch closely for how policy, business decisions, spending, and the consumer relate to each other. Fundamentals (“the numbers”) will always win in the long-run, but sentiment drives the game in the short-run. The divergence of the two is where money is made and lost. So far sentiment is high, and fundamentals are good. When that diverges, one way or another, it’s time to reassess long-term goals.
University of Michigan Consumer Sentiment