
Perspective
Medium term perspective for Canadian and US stock prices looks neutral at the moment. After offering up a SELL signal on January 18th 2022, the prices for listed shares are trying to find a level that balances the risks and rewards considering the present economic conditions.
The chart below shows the S&P500 with its 200 day moving average plotted in blue.
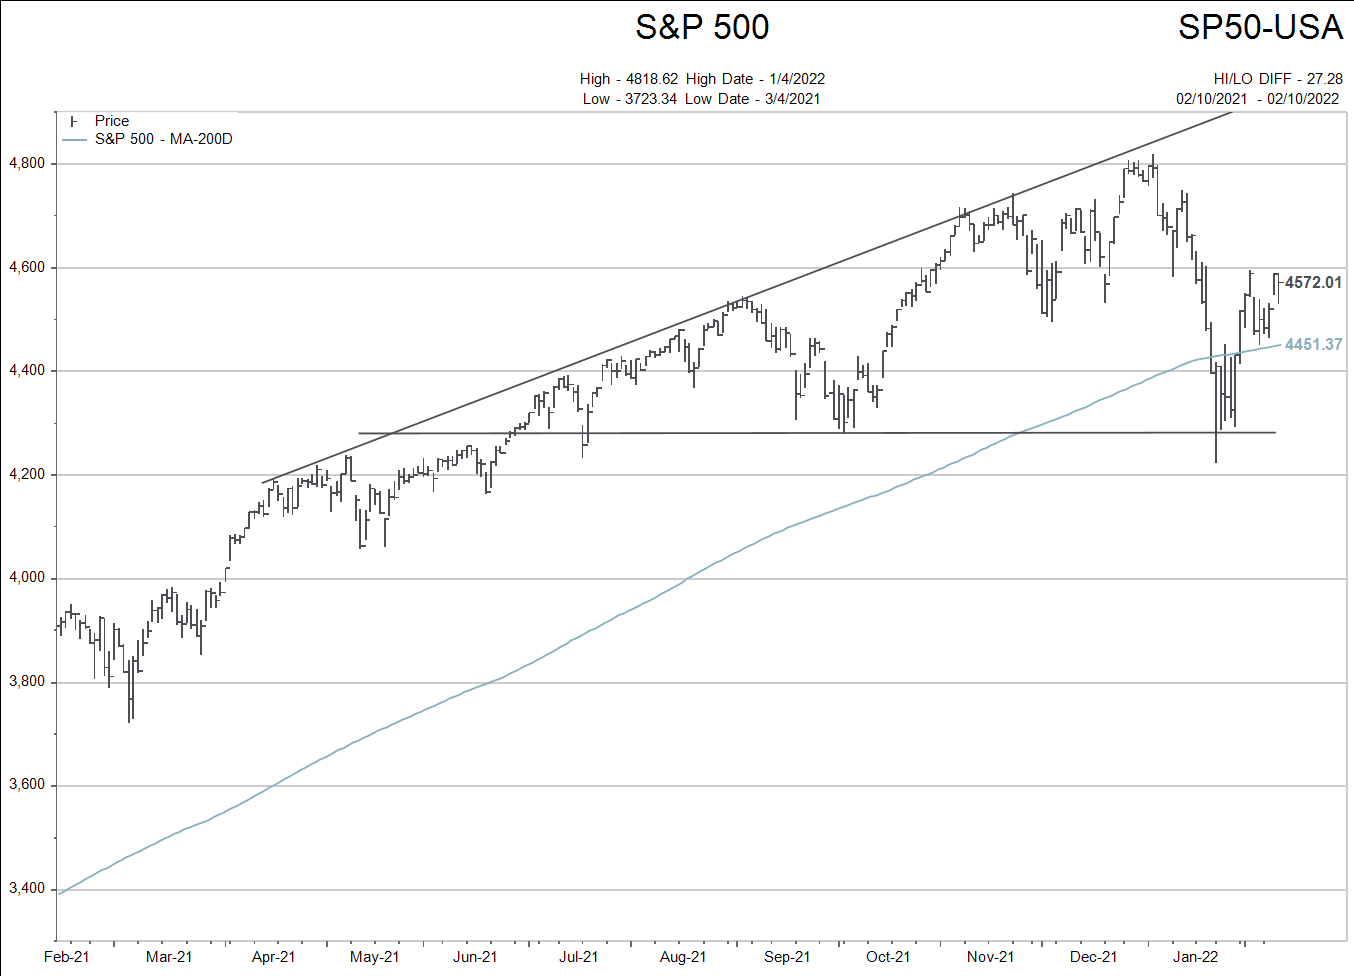
A decline back below the 200 day moving average of 4443 would re-ignite the January 18th SELL signal but not cause me to take any action. A break of the horizontal line (4280) confirming a “head and shoulders” top would be an actionable to lower stock market exposure again.
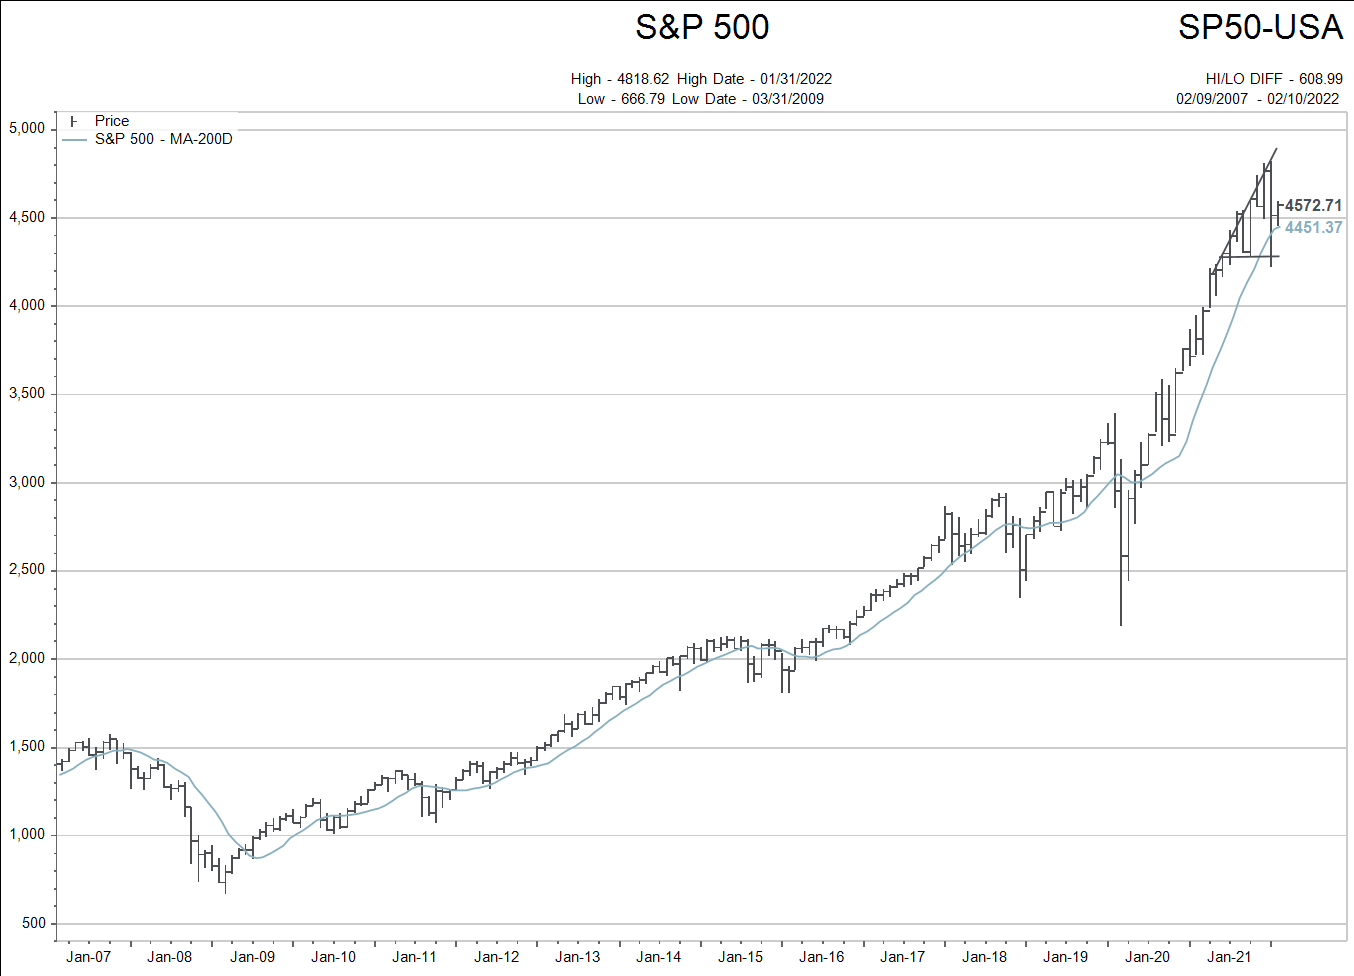
The longer term view of this data makes it clear the general US stock market is not cheap.
The Canadian stock market is less concerning. We’ll start with the long term chart and zoom in to the short term later.
Notice below how the extremity of the move higher in Canada does not compare to the US chart above.
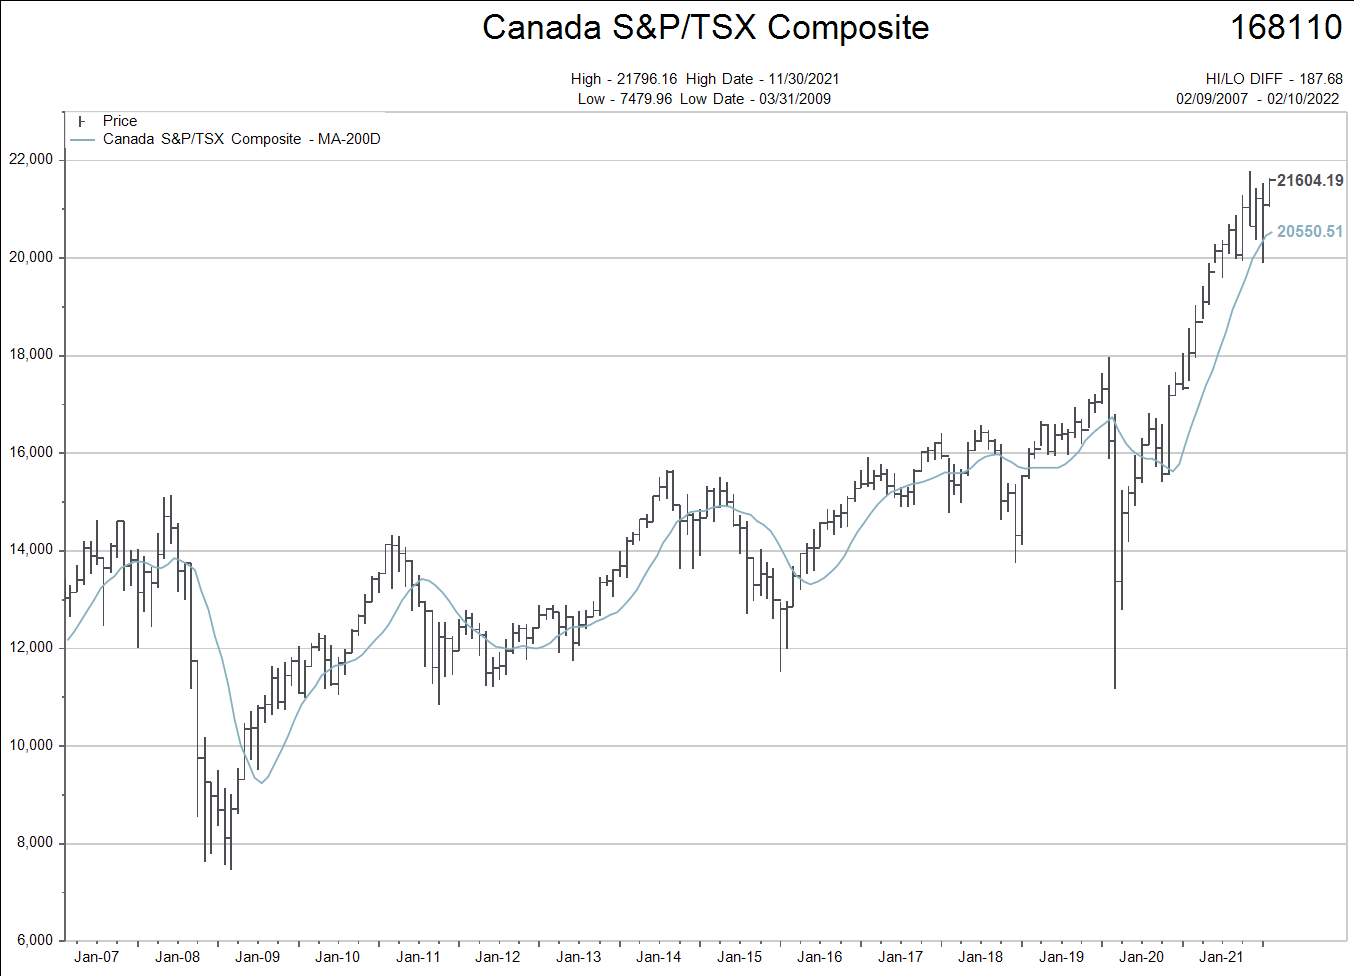
There are pockets of reasonable valuation in both markets but the Canadian index itself is not anywhere near as extreme as the US.
To reiterate: Know What You Own.
That said, Canadian investors should have a plan for the possibility of higher interest rates and lower asset prices.
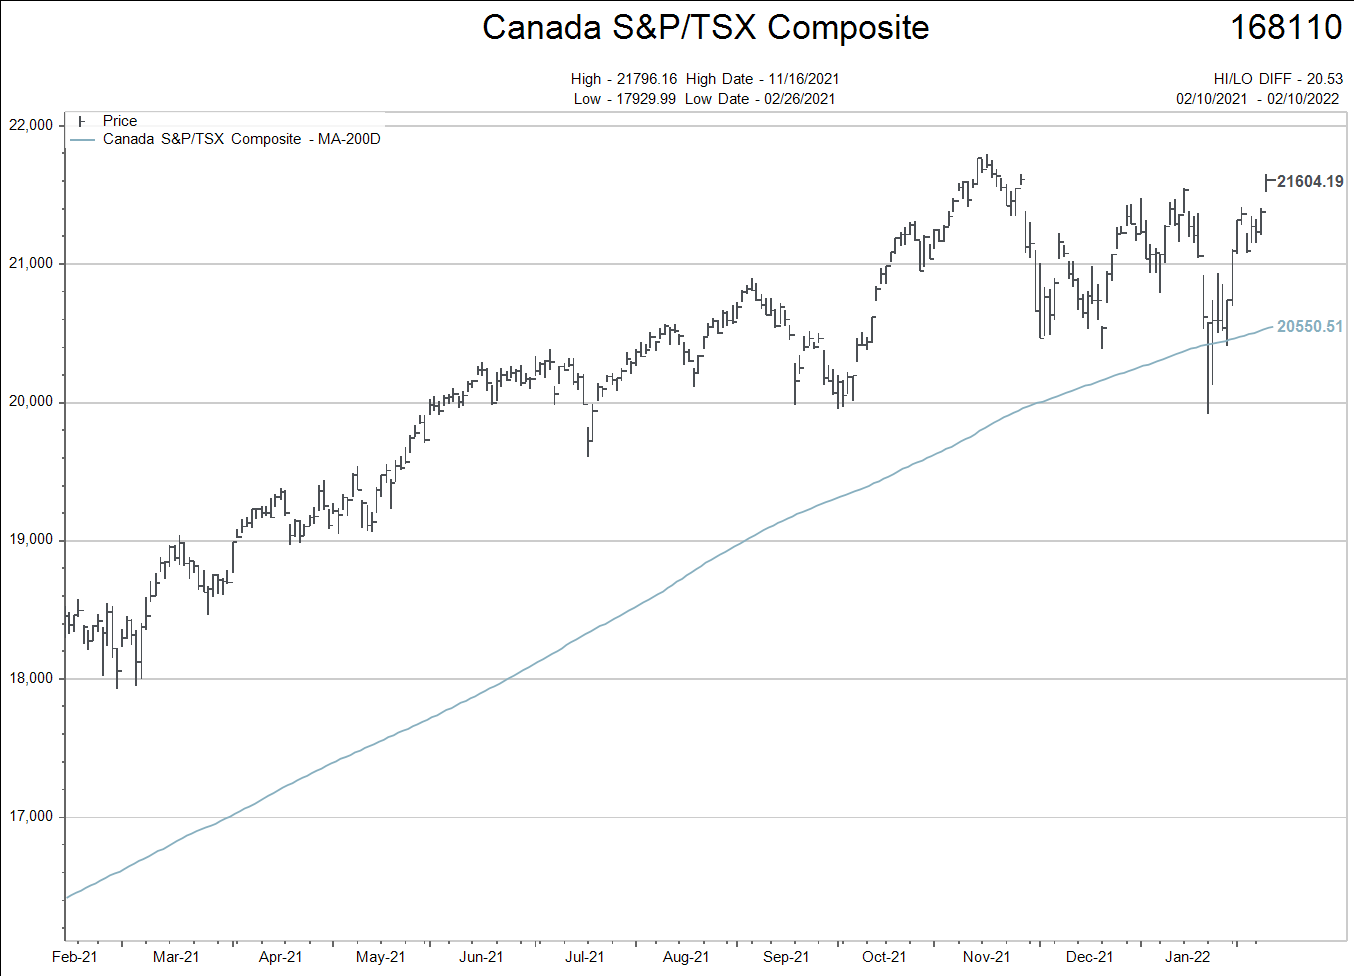
A simple idea would be to continue to use the blue 200 day moving average line as a “reduce to minimum equity exposure” spot.
I have gone over this with all of this in the past. The note today is just a Readers Digest type reminder.
Call if you feel you want to make any adjustments.
Inflation
So much ink being spilled about inflation these days. People are truly concerned about it at this point in time.
The following chart shows what, to me, is the critical aspect as to why both normal people and central banks are now very concerned with inflation.
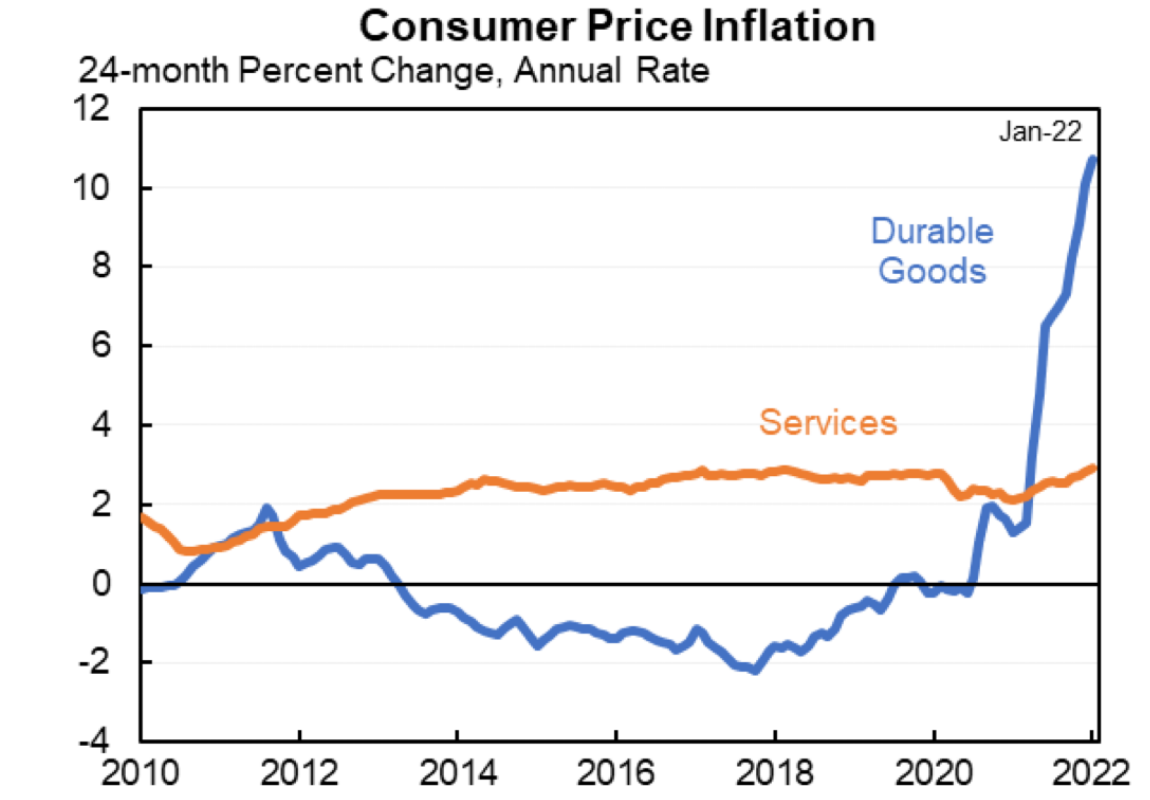
The runaway inflation in durable goods has included the stock and real estate markets. Owners of these assets have not been too worried about this kind of inflation since it has been to their benefit.
But with the uptick in services (wages) the narrative changes.
I know that is an oversimplification but it gets one thinking on the right track about “why now” all this inflation concern is becoming a topic of conversation.
The second chart amplifies the reasons for the concerns about non-transitory inflation.
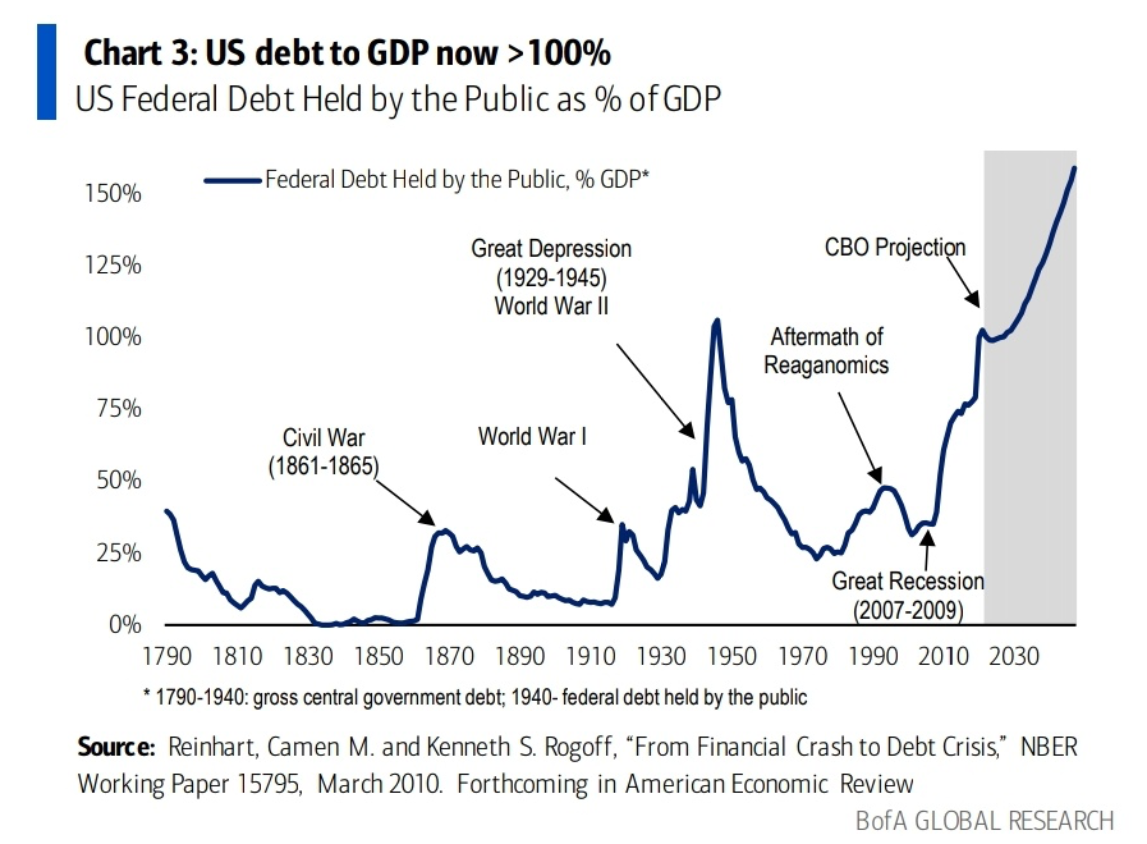
As all that debt starts to cost consumers, companies and governments more interest, there is less money left over of other productive activities and budget expenses.
Lots of moving parts to the financial landscape these days. It pays to stay alert.