
“Head-in-the-sand Inflation”
The next paragraph is meant to be blunt.
The US Federal Reserve is ignoring inflation that has stopped going lower and is still planning to cut interest rates anyway. There should be no surprise that Oil, Gold, and Bitcoin (Cryptocurrencies) are ripping higher.
Inflation is CUMULATIVE. The past 3 years have seen an approximately 27% aggregate price increase. Just because inflation is back at +3% doesn’t mean anything got cheaper in the real economy.
The bond markets are about to call the Federal Reserve out on their stance. With interest rates staying “higher for longer” I felt like a dive back into the data about how US household debt has progressed was in order. The following chart is a perfect snapshot of the state of US household finances.
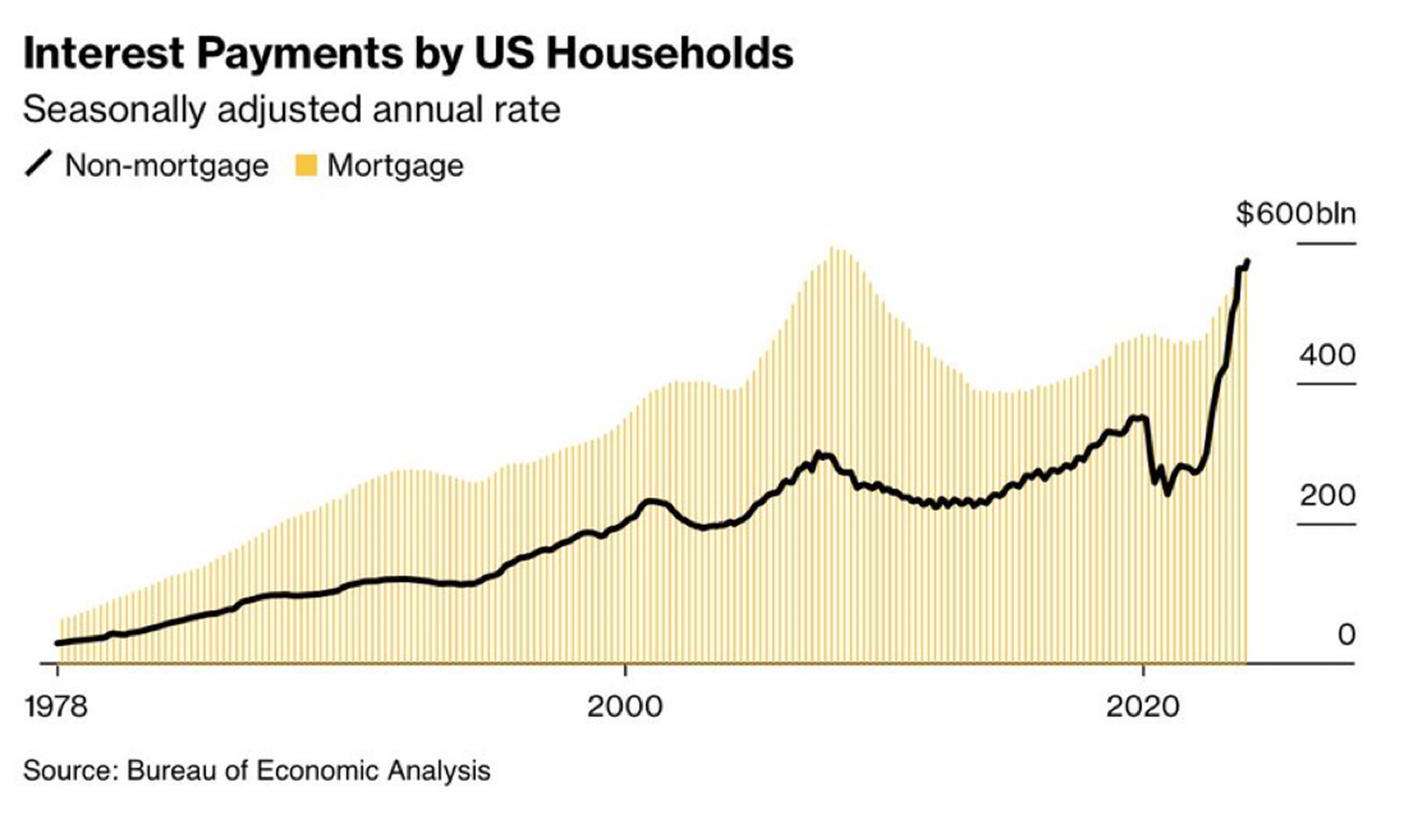
Americans prefer 30-year fixed rate mortgages, so the yellow bars representing mortgage debt are slow to trend higher since these mortgages turn over slowly.
The black line represents non-mortgage debt which tends to be revolving. Interest rates have jumped higher on this class of debt AND it is growing in aggregate amount outstanding. Hence, the vertical black line.
With US asset prices at all-time highs, it is a bit surprising to see such a fast ramp up in non-mortgage interest payments.
Another reason for the revolving debt run up is the COVID era government savings glut accumulated by consumers has almost been burned through now.
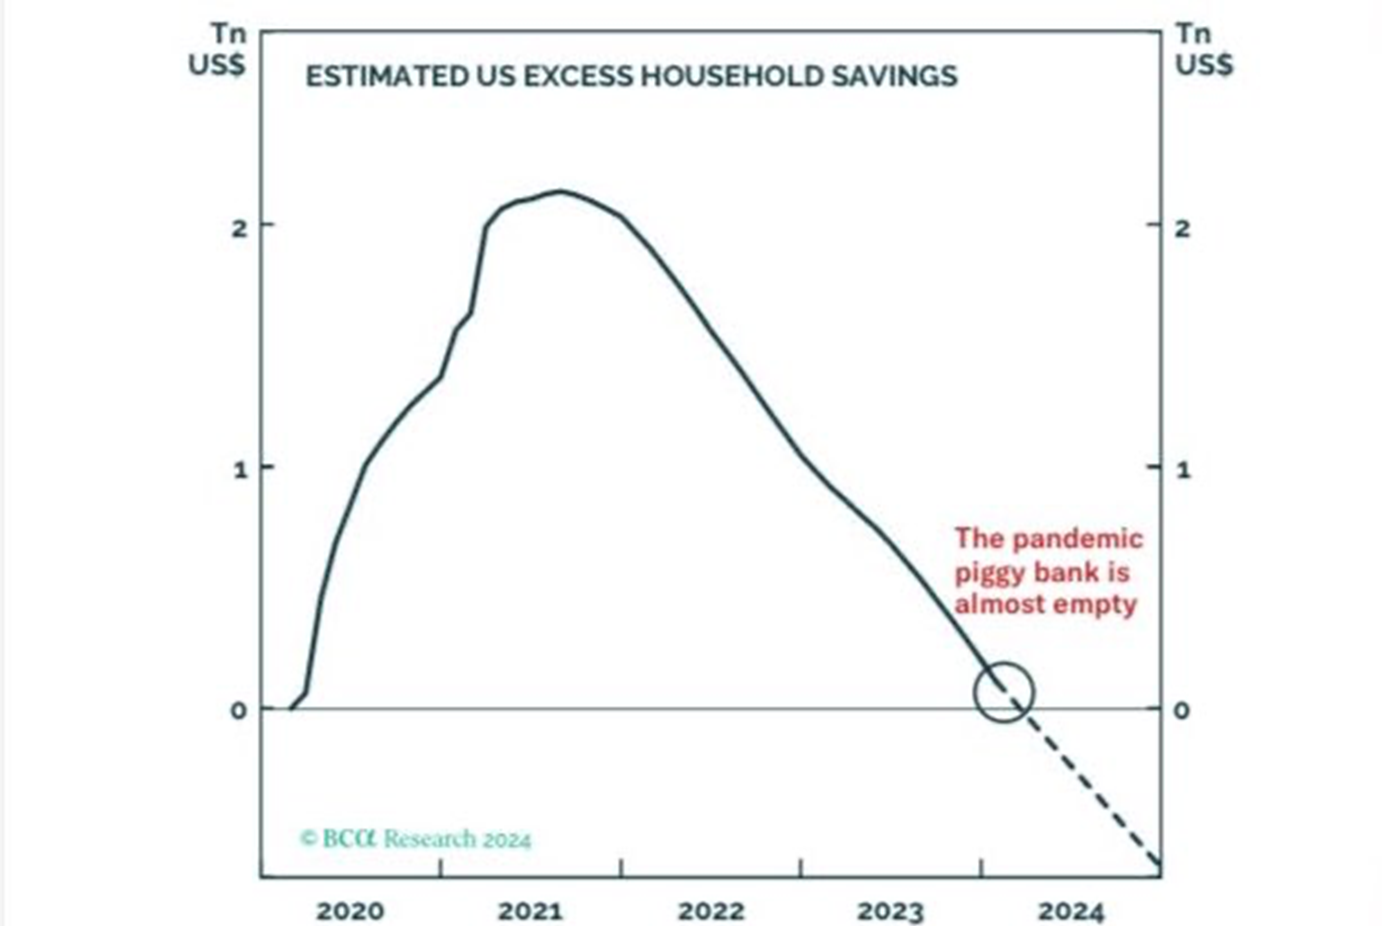
At its peak, that was over $2 trillion in excess savings!
It is an election year in the US so who knows what might happen in terms of fiscal stimulus in coming months?
The bottom line is that consumer spending is running into some major headwinds and investors should take notice.
Let’s completely shift gears here and look at some employment statistics in the US.
The chart below shows US full time employment.
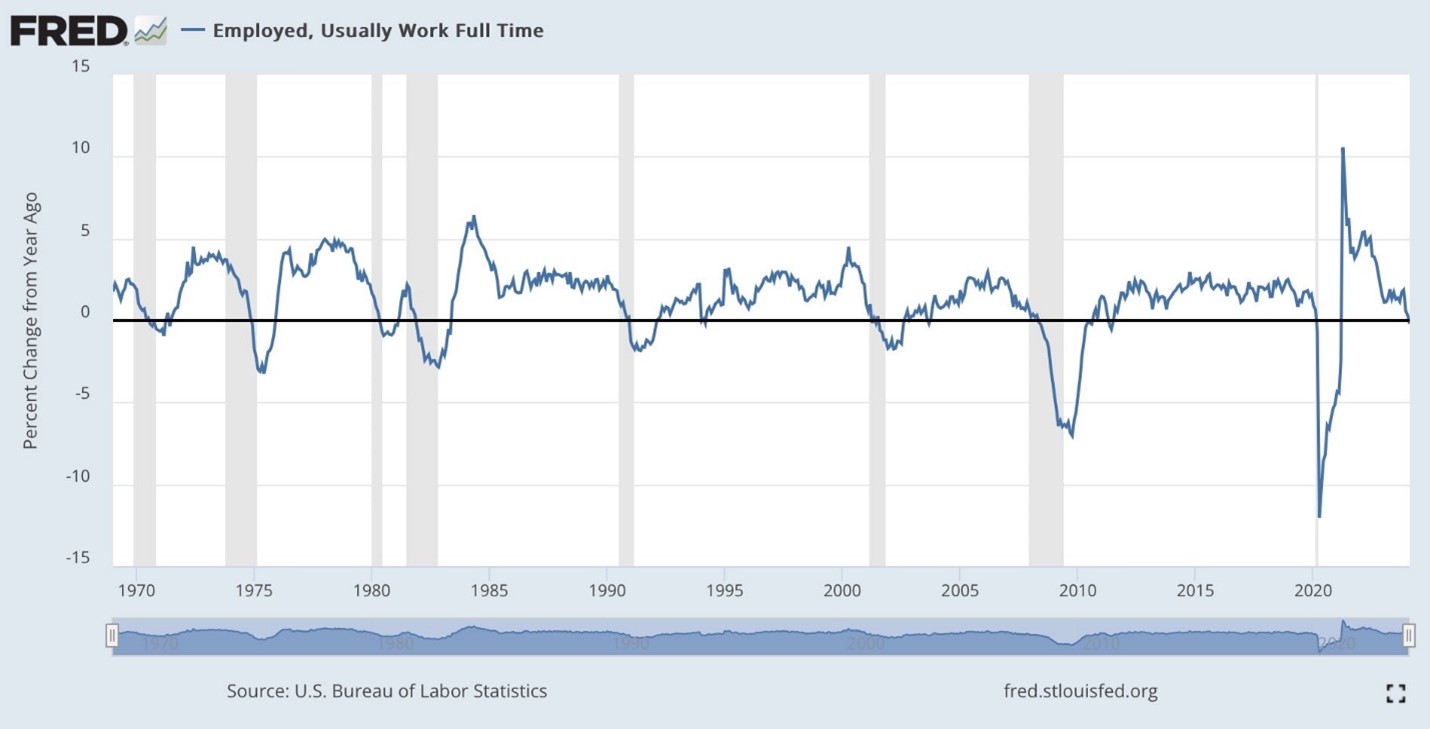
It is interesting to see how the employment numbers in the US stay high, yet full time employment growth statistics are down to levels usually associated with early-stage recessions.
The economists and commentators continue to use this data series for their own narrative justification.
Those BULLISH on the economy choose to ignore the chart above and just trumpet the combined (full time/part time) employment data as everything is awesome!
Those BEARISH on the economy quickly trot out the chart above and make the case for an imminent recession.
Let’s take a different view of the data. Please look at the chart below.
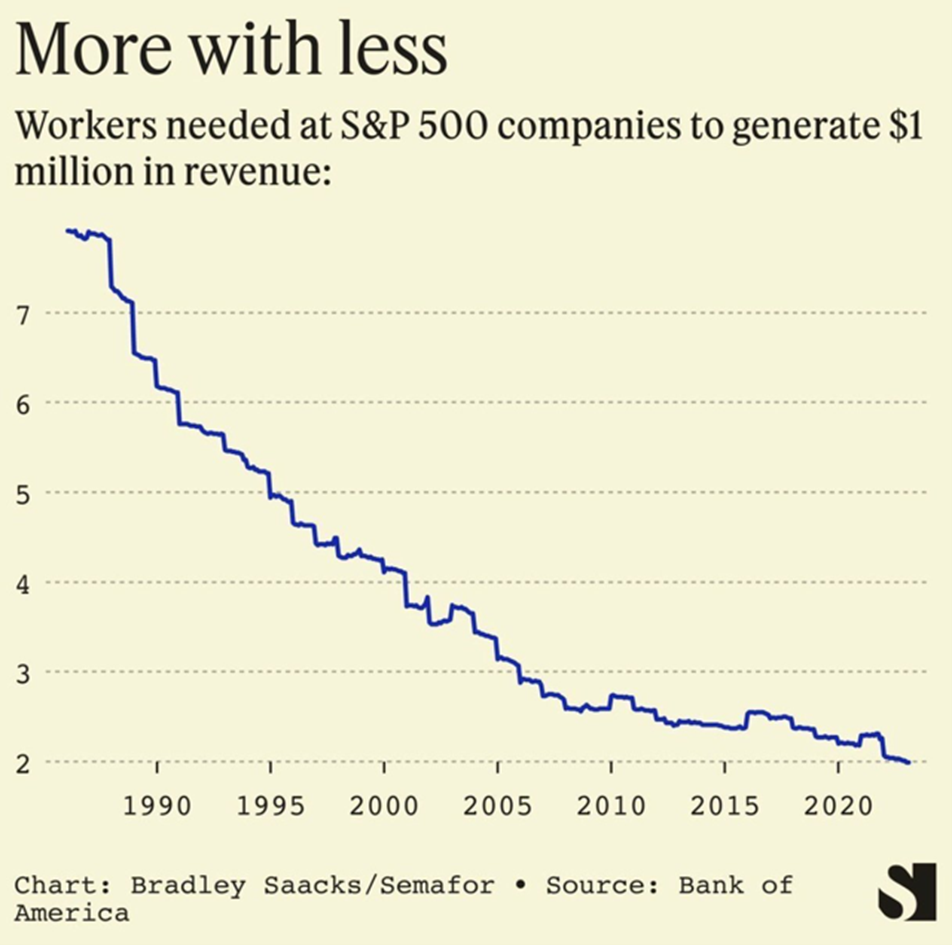
What if all we are witnessing is the continued downtrend in tradition white-collar jobs available?
Artificial Intelligence is going to steepen the descent of the chart above…and that is saying something!
Maybe full-time employment can continue to fall, and the economy can continue to grow at the same time? That would be my best guess as to what is happening.
But this brings another important question to mind.
How can there be enough high paying jobs to support the high prices of assets spread throughout the US economy once the COVID savings glut is depleted?
A decent question to ask. Not likely to be an issue in an election year but will become more pertinent in 2025.