
Quarterly Commentary as of March 31, 2025
Investors entered 2025 with caution, expecting the first quarter to follow a familiar post-election cadence; modest growth and a clear path forward led by a new (although somewhat familiar) US administration.
However, the first quarter was characterized by the beginning of a more virulent tariff war than during President Trump’s first term. In February, the tariffs only targeted Canada and Mexico, which brought on significant volatility to the Canadian dollar, interest rates, and the Canadian stock market. However, since the trade conflict has targeted more than 170 countries, the pressure on Canada has eased. Global financial markets have instead interpreted it as the United States isolating itself from the rest of the world.
The rhetoric alone was enough to ripple through equity and bond markets, triggering increased volatility (the VIX, otherwise known informally as the “fear index” reached levels seldom achieved in the past aside from clear geopolitical and financial shocks), and forcing investors to reassess expectations. What was shaping up to be a routine start to the year quickly evolved into a more complex environment, driven by headlines and geopolitical posturing.
Consequently, the US market has been the hardest hit since the beginning of the year.
The first warning signal was sounded by the US government's 30-year bond yield, which briefly exceeded 5% in early April. As the United States will have nearly $9 trillion in debt to renew in 2025 (which corresponds to approximately 25% of all US debt), the US president is very sensitive to variations in interest rates, which has led him to soften his tone towards some trading partners.
Tariffs, by nature, act as a tax on imported goods. While they may be designed to protect domestic industries, they often result in higher input costs for businesses and elevated prices for consumers. This inflationary pressure can eat into consumer spending power and corporate margins, especially if the supply chain lacks flexibility. At the same time, tariffs can dampen economic growth by reducing trade volumes and creating uncertainty for business investment.
This combination – slowing growth alongside rising prices – is the hallmark of stagflation, a rare and particularly challenging economic scenario. Unlike typical inflationary periods, stagflation doesn’t respond well to traditional monetary policy tools. Central banks face a dilemma: raise interest rates to tame inflation and risk further slowing the economy, or provide stimulus and risk fueling even more inflation.
What makes tariffs especially troublesome is their persistent impact. Even after the initial headlines fade, the downstream effects – altered supply chains, reduced productivity, lower confidence – can linger. This creates a kind of structural shock to the economy, one that is not easily reversed with policy shifts or short-term fixes. Considering these consequences, economists still hope that tariffs will fade by the second half of the year, otherwise a recession could quickly set in.
Q1 2025 Performance
The year’s first quarter performance turned out better than one might expect, considering it was marked by the beginning of volatility in equity markets brought on by President Trump’s threat of tariffs. Our regular readers may recall we called for prudence (here and here) following several quarters of good market performance. Here are the results in CAD for the various indices for the quarter ending March 31, 2025 (you may notice the underperformance of the US markets):
- +1.5% for the Canadian S&P/TSX Index
- -4.2% for the US S&P 500 Index in C$
- +6.2% for the Europe-Asia-Far East Index
- +2.0% for the FTSE TMX Canadian Bond Fixed Income Index
Quarterly performance: a balanced portfolio’s return fluctuates between +0.0% and +2.0% for the first quarter of 2025, and between +9.5% and +11.5% for 1 year, in CAD.
From RBC Wealth Management’s Global Insight Special Report: Shock and Tariff
Is this correction different?
The nature of stock market corrections reminds us of the old expression, “It’s never happened before and here it is again.”
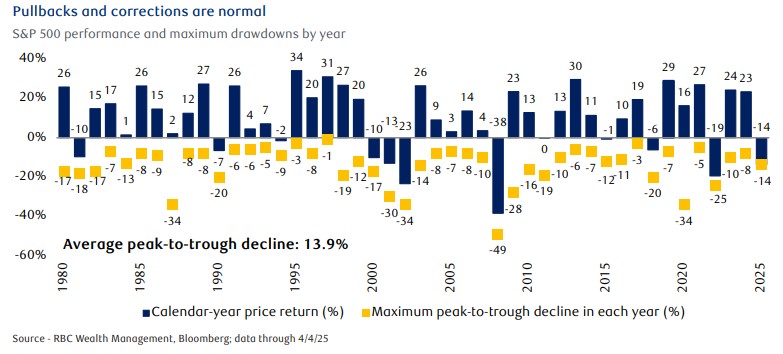
- Since 1928, the S&P 500 has experienced 103 corrections of 10 percent or more and 27 corrections of 20 percent or more.
- In the modern era since 1980, the average maximum peak-to-trough decline in the S&P 500 each year was 13.9 percent, as the chart below shows. In other words, corrections have been commonplace.
- During this modern era period, the S&P 500 declined by 15 percent or more peak to trough during 16 of the 45 years through 2024. In nine of those years, it declined by 20 percent or more peak to trough.
- Nevertheless, since 1980, the S&P 500 traded higher for the year in 35 of the 45 years.
- Since 1980, the market fell in consecutive years on only one occasion, in 2000, 2001, and 2002, a period when the technology bubble burst, the 9/11 attacks occurred, the U.S. began its military intervention in Afghanistan, and a mild recession arose.
Putting Volatility in Perspective: The Role of Equity Market Corrections
It’s important to remember that equity-market corrections are a normal feature of the investing landscape. Since 1980, the S&P500 has experienced an average of one correction every 1.5 years, even amid long-term upward trends. Corrections can be unsettling in real time, but they often reflect the market’s way of digesting new information – whether it’s economic data, corporate earnings surprise, or, in this case, trade-policy risk.
Far from being anomalies, corrections serve a valuable purpose: they reset valuations and can create opportunities for long-term investors.
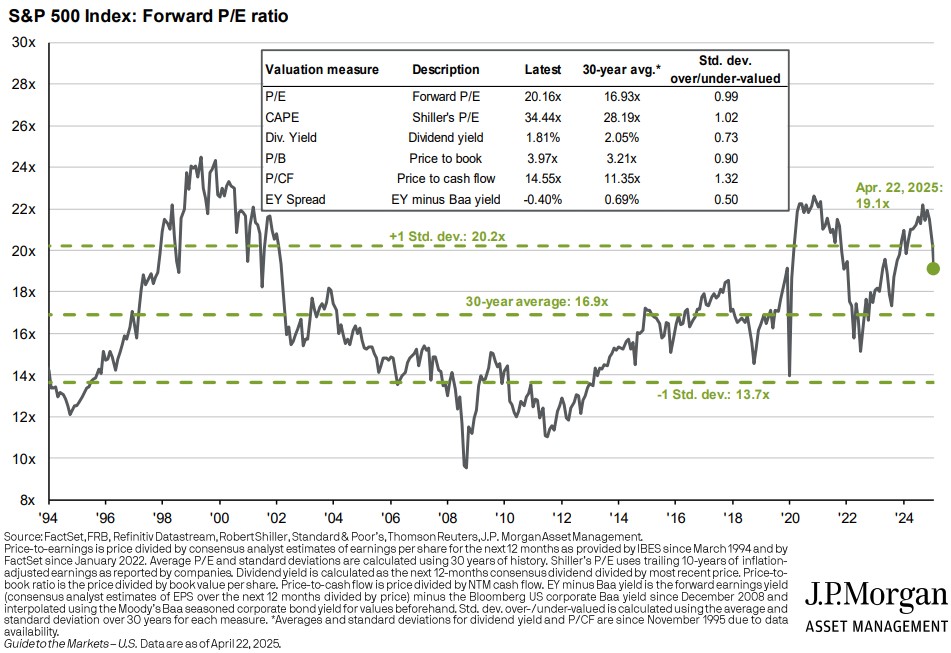
Since the end of 2022, equity markets had stretched into historically elevated valuation territory. Fueled by the post-pandemic rebound, fiscal stimulus, and low-rate environment, the S&P500’s forward price-to-earnings (P/E) ratio climbed well above its long-term average of around 17x. By late 2023 and early 2024, many sectors were trading at premiums that left very little room for error. The recent market correction has helped bring valuations back down towards more normal levels – today’s forward P/E sits in the mid-teens, much closer to its historical norm, but still above the 30-year average.
Looking ahead, we expect corrections to remain a feature of market dynamics. Elevated uncertainty around trade policy, interest-rate decisions, and geopolitical events means that headline-driven swings will continue. However, for investors with well-diversified portfolios and a focus on high-quality assets, these pullbacks can be weathered – and even leveraged – to strengthen long-term outcomes.
As we welcome the first signs of spring, we would like to take a moment to sincerely thank you for placing your trust in us. In this season of rebirth, we wish you a wonderful spring!
“Spring is the time of the year when it is summer in the sun and winter in the shade.”
-Charles Dickens
Mathieu & Anthony
This information is not investment advice and should be used only in conjunction with a discussion with your RBC Dominion Securities Inc. Investment Advisor. will ensure that your own circumstances have been considered properly and that any action is taken based upon the latest available information. The strategies and advice in this report are provided for general guidance. Readers should consult their own Investment Advisor when planning to implement a strategy. Interest rates, market conditions, special offers, tax rulings, and other investment factors are subject to change. The information contained herein has been obtained from sources believed to be reliable at the time obtained but neither RBC Dominion Securities Inc. nor its employees, agents, or information suppliers can guarantee its accuracy or completeness. report is not and under no circumstances is to be construed as an offer to sell or the solicitation of an offer to buy any securities. report is furnished on the basis and understanding that neither RBC Dominion Securities Inc. nor its employees, agents, or information suppliers is to be under any responsibility or liability whatsoever in respect thereof. The inventories of RBC Dominion Securities Inc. may from time to time include securities mentioned herein. RBC Dominion Securities Inc.* and Royal Bank of Canada are separate corporate entities which are affiliated. *Member-Canadian Investor Protection Fund. RBC Dominion Securities Inc. is a member company of RBC Wealth Management, a business segment of Royal Bank of Canada. â / ™ Trademark(s) of Royal Bank of Canada. Used under licence. © RBC Dominion Securities Inc. 2025. All rights reserved.â / ™ Trademark(s) of Royal Bank of Canada. Used under licence. © RBC Dominion Securities Inc. 2025. All rights reserved.