Subdued economic growth and troublingly persistent inflation suggest the UK may well fall victim to stagflation in 2024 if the labour market deteriorates further. The Bank of England is unlikely to be willing to cut interest rates before the second half of the year, in our view. Despite the unpalatable macroeconomic backdrop, we see opportunities for patient investors. UK equities are attractively valued, largely unloved, and offer defensive characteristics. As for UK bonds, we have a bias towards adding further to Gilts and increasing duration in the near term.
UK equities
The UK’s challenges continue but its unloved equities offer opportunities.
A changing of the guard? The next UK general election is likely to be held in 2024. Given that the traditionally left-wing Labour Party has consistently held a large lead in the polls for more than a year, it is worth considering how the party would govern once in power.
Under its leader Sir Keir Starmer, Labour has changed its spots. The policies of its radical left-wing faction, such as imposing higher taxes on high earners and nationalizing utilities, have been abandoned. The party seems to have transitioned towards the center and has markedly improved ties with the corporate sector. Overall, we do not think a Labour win would incite a strong negative reaction in financial markets.
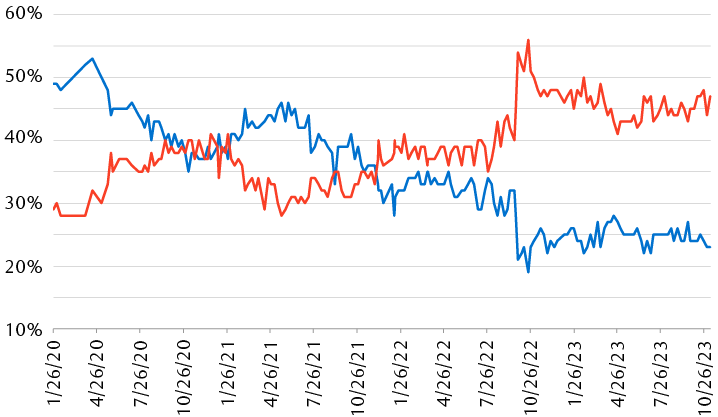
The Labour Party has outperformed the Conservatives for two years
YouGov Westminster Voting Intention Tracker

The line chart shows the voting intentions in the UK for the two main political parties: the Conservatives and Labour. Since November 2021, Labour has gained an advantage. The gap has markedly widened since September 2022, and Labour now commands 47% of the vote intentions compared to 23% for the Conservatives.
Source - YouGov; data through 11/8/23
Labour also aims for a closer relationship with the EU, including a regulatory alignment of “certain sectors” and accepting some oversight by the European Court of Justice. Labour is also looking to deregulate the planning rules for new homebuilding, strengthen employment rights, and forge ahead with the transition to a low-carbon economy.
Some of these aims may be difficult to achieve, in our view. The EU is unlikely to accept this “cherry picking” approach, and reforms to national planning policy may well continue to meet fierce domestic opposition as they threaten to change the landscape. Importantly, Labour would inherit governorship of a country with deep scars—not only from Brexit but also from the fastest spree of monetary policy tightening by the Bank of England (BoE) in three decades—and one that is heavily indebted with gross debt to GDP approaching 100%. All of this may limit a new government’s ability to reboot the economy.
A struggling economy. Economic data, which softened throughout 2023, is likely to slip further as the full impact of much higher interest rates increasingly filters through the economy. We think this will likely be partly offset by an improvement in real wages as inflation has declined. But much depends on the labour market. The risk is that it could weaken should the impact of higher rates exert pressure on corporate profit margins. Unemployment increased from 3.7% in January to 4.3% of late. Overall, a consensus group of economists expects GDP growth of a mere 0.4% in 2024, on par with the level in 2023.
Despite this weak growth outlook, we think the BoE will likely keep the Bank Rate, currently at 5.25%, elevated for much of 2024. Core inflation has waned but remains sticky, at 5.7%.
We see risk of stagflation in the UK, a state characterized by relatively high inflation together with slow economic growth and rising unemployment.
Opportunities in an unloved market. We acknowledge the challenging domestic economic prospects but continue to recommend a Market Weight position in UK equities. We believe the FTSE 100 Index’s defensive qualities should hold it in good stead given the more volatile backdrop we are expecting for the global economy and global equities in 2024. The UK’s blue-chip equity index, the FTSE 100, has relatively large exposure to defensive sectors (e.g., Health Care and Consumer Staples). Moreover, it has a bias to “old economy” industries, including Energy (approximately 14% of the FTSE 100), a sector where the risk-reward is favourable at present, in our view, given the tight supply-side dynamics, inexpensive valuations, and improving earnings momentum. Importantly, UK equity valuations appear undemanding, with almost every sector trading at an abnormally high discount relative to history.
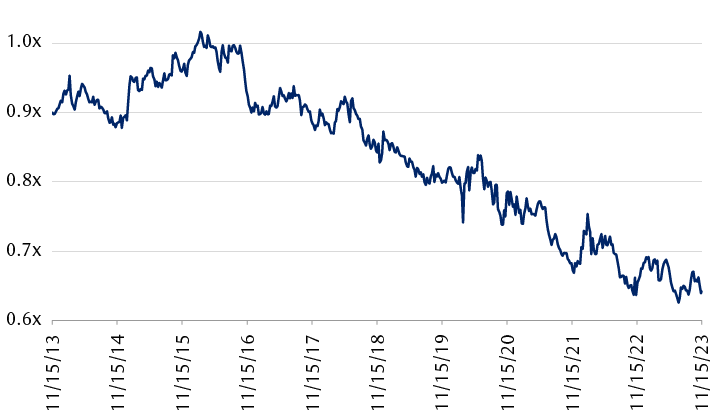
UK equities are at the cheapest level relative to global equities in 10 years
Valuation of FTSE All-Share Index versus FTSE World Index

The line chart shows the relative value of UK equities (represented by the FTSE All-Share Index) versus global equities (represented by the FTSE World Index) from November 2013 through mid-November 2023. The relative valuation shows an overall downward trend since mid-2016, and is now close to its lowest level in that timeframe.
Source - RBC Wealth Management, Bloomberg
Given the challenging domestic economic prospects, we remain cautious on companies with UK-centric revenues. We continue to recommend maintaining a bias for globally diverse, high-quality businesses. Across the market, the valuation multiples of many leading UK-listed global companies remain at a notable discount to their international peers listed in other markets. We view this as an unwarranted “UK market discount” on these global companies, and think this presents an opportunity for long-term investors in these stocks.
UK fixed income
The window of opportunity in fixed income appears fully open.
The question for bond investors is not how much more will the Bank of England (BoE) hike interest rates, but rather when will the first rate cut come through to propel bond returns. Our base case is no rate cuts through H1 2024 due to still stubbornly high inflation and wage growth. The Monetary Policy Committee (MPC) is likely to keep its hiking optionality, but we think the bar remains high for further hikes and 5.25% is likely the peak for this cycle. The market currently expects around 75 basis points (bps) worth of cumulative cuts to reach 4.56% in Q4 2024.
Inflation will likely meet the BoE’s Q4 2023 estimate, but this is still far from its 2% target. The November Monetary Policy Report utilised the market pricing in October which showed the Bank Rate at 5.25% throughout 2024. In this scenario, inflation only falls below target in Q4 2025, with a caveat of upside risks to this estimate—this heightens our conviction of no rate cuts in H1 2024. If there are any large and persistent surprises in inflation or wage data which exceed the MPC’s forecasts, the policy reaction would likely be to keep rates elevated for longer to maintain restrictive financial conditions, albeit at the expense of economic growth. The risk to our view of no rate cuts in H1 stems from the deteriorating growth outlook and the mortgage refinancing headwinds further hampering consumer demand, which could cool inflation faster than we expect.
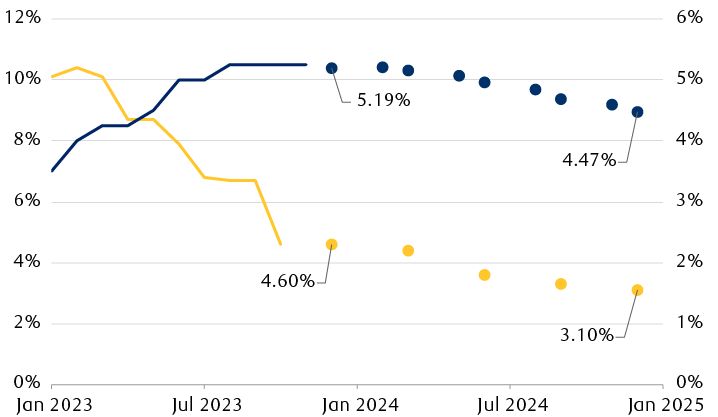
Markets defy Bank of England’s higher-for-longer narrative

The line chart shows historical values and future estimates of the Bank of England’s policy interest rate (the Bank Rate) and the UK Consumer Prices Index (CPI) inflation rate, starting in January 2023. The last historical data point for inflation is 4.6% in October 2023, and the last data point for the Bank Rate is 5.25% in November 2023. The market-implied estimate of the Bank Rate reaches 4.47% at the end of 2024, and the Bank of England’s inflation forecast is 3.1% in the fourth quarter of 2024.
Note: CPI = Consumer Prices Index; projections show Bank of England (BoE) November 2023 staff forecast; data as of 11/15/23.
Source - RBC Wealth Management, Bloomberg, Bank of England
Though the UK economy has fared slightly better than we anticipated, the outlook for growth is broadly flat for the next 12 to 18 months and the risks of a recession remain high, in our view. RBC Capital Markets is forecasting growth to stall in Q1 2024 at 0% q/q and mildly recover in the following quarters to reach a meagre 0.1% y/y in 2024.
Turning to Gilt supply, officials are reducing the BoE’s balance sheet (otherwise known as quantitative tightening) at a pace of £100 billion over a 12-month period, which has been priced in by markets. According to a recent government report, public finances have performed better than initially forecast in March, resulting in a lower borrowing requirement this fiscal year. RBC Capital Markets expects a £20 billion reduction in Treasury Gilt issuance to reach around £218 billion in gross supply this fiscal year. Gilt demand remains robust, but we are monitoring for signs of waning demand at future bond auctions, which could send yields higher. We have a bias towards adding further to Gilts and increasing duration in the near term.
Credit markets held up better than we expected in 2023, but it is not clear to us how much longer this “goldilocks” period will last. On a one-year basis credit spreads look wider, but they are nearer to fair value over a five-year period. Consequently, the risks that spreads will widen are still high, in our view. Corporate default rates remain low, but credit fundamentals are worsening. Non-financial issuers’ debt leverage ratios have increased due to weaker corporate earnings. Furthermore, higher interest rates have led interest coverage—the measure of how many times a company’s earnings can pay interest costs—to also worsen.
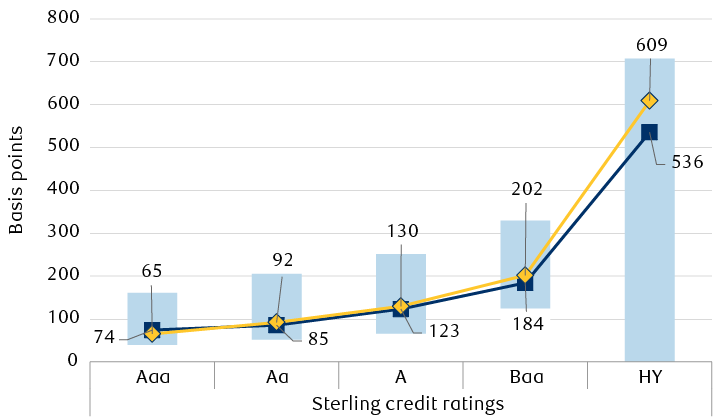
Lower-quality credit spreads are above their five-year averages

The chart shows corporate bond spreads by credit rating (“AAA”, “Aa”, “A”, “Baa”, and “high-yield”) for the UK market based on the Bloomberg Sterling Aggregate Corporate Index. Five-year range bars show the difference between the maximum and the minimum spread from November 2018 through November 2023 in basis points. For each rating category, the five-year average spread and the current spread are also shown, as follows: Aaa-rated, 74 average, 65 current; Aa-rated, 85 average, 92 current; A-rated, 123 average, 130 current; Baa-rated, 184 average, 202 current; high-yield-rated, 536 average, 609 current.
Source - RBC Wealth Management, Bloomberg; data through 11/10/23
Nevertheless, we see pockets of opportunity in non-cyclical issuers, as well as opportunities in senior-ranking bank bonds. We remain cautious and favour higher quality, short-duration investment-grade bonds over high-yield bonds as the balance of risks is tilted to the downside.
A barbell approach presents the most attractive opportunities, in our view, as we would balance risks in corporate credit with higher-quality allocations in government bonds.
View the full Global Insight 2024 Outlook here
