
The Markets
The TSX is up 1.5% for the month of July and 10.2% year to date.
The S&P 500 is up 2.2% for the month of July and 7.8% year to date.
The NASDAQ is up 3.7% for the month of July and 9.4% year to date.
(Numbers as of close July 31, 2025)
I have attached our Global Insight Weekly dated July 31st, 2025.
From RBC Global Asset Management (as of August 1, 2025)
Today marks the August 1 tariff deadline set by President Trump. The full extent of its impact remains to be seen, and the tariff landscape is constantly in flux. But its overall effect has been significantly diminished as countries representing more than one-third of U.S. imports have now secured deals with the U.S., avoiding large reciprocal tariffs. While some countries face tariff increases effective August 7, these are generally lower than initially threatened.
Ultimately, a vast majority of U.S. imports are likely to be shielded. Mexico secured a 90-day extension for negotiations and China is reportedly close to a similar reprieve, while Canada faces a tariff hike of 35% (up from 25%) effective August 1, but the threat is still limited due to the USMCA (United States-Mexico-Canada Agreement).
U.S. – holding up
The U.S. has collected a record-breaking $125 billion in customs duties year-to-date. However, the impact on inflation has been slower than anticipated. For example, only half of the predicted effect of a 20% tariff on Chinese imports was reflected in U.S. inflation data between January and March 2025.
So far, tariff costs are being distributed throughout the supply chain. While there is evidence of foreign exporters and U.S. importers absorbing some tariff costs, there is still notable passthrough to U.S. consumer prices. June's CPI report showed clear signs of tariff pressure, with the price of goods (excluding food, energy, and autos) posting its largest month-over-month increase since the pandemic inflation shock. Most import-intensive products saw growing price pressure in June. We're still in the early stages of this tariff shock, with significant uncertainty surrounding the level at which tariff rates will ultimately settle. But we continue to think significant tariff pass-through to U.S. consumers, exacerbated by currency depreciation, will cause U.S. inflation to accelerate to around 3.5% over the next year.
Regarding the U.S. economy, it continues to show resilience, with strong retail sales and a recent higher than expected Q2 GDP release showing 3% annual growth. Jobless claims have improved, and the Beige Book indicates a slight improvement in business sentiment. However, concerns about stagflationary pressures from tariffs persist.
Canada – reasonably shielded but vulnerable
Canada's economy is already feeling the effects of earlier rounds of tariffs, particularly on steel, aluminum and autos. A new 50% tariff on copper will add to that impact, but less than previously feared with about half of U.S. copper imports exempted. The dollar value of Canadian copper exports subject to the new levy is significantly less than steel and aluminum exports.
Despite the exemptions, tariffs on semi-finished copper products will increase costs for American industries including construction, machinery, vehicles and electronics. While U.S. copper production may increase over time, it will take years for domestic capacity to catch up, leading to higher copper prices in the short to medium term.
The proposed 35% tariff rate on Canadian exports is concerning, but its impact is not as severe as it initially appears. This rate only applies to products that do not comply with the USMCA. Fortunately, only about 5% of Canadian exports fall into this category. Though these businesses will be substantially affected, the economic damage at the aggregate level is not expected to be devastating. However, there is a risk that a larger fraction of Canadian products could become subject to the 35% tariff over time, increasing the economic damage.
Notably, any deal reached in the coming weeks may not lock in the trading rules between the U.S. and Canada over the longer term. The USMCA trade deal is up for renewal on July 1, 2026, and President Trump may use this opportunity to pursue his grievances, including Canada's supply management system. This could be challenging to resolve, given recent legislation in Ottawa blocking Canadian concessions in this area.
Final thoughts
While the August 1 tariff deadline's impact has been somewhat mitigated by trade deals and extensions, the U.S. economy faces ongoing challenges from tariffs and other factors. Canada's situation remains murky, with the potential for future trade tensions. The coming months will be crucial in shaping the global trade landscape.
Wealth Management
Real estate vs. equities: Which builds more wealth?
For Canadians, real estate has long been the go-to path to wealth. It’s familiar, tangible, and offers the comfort of control. But while housing markets have delivered steady gains, equity markets, particularly in the U.S., have quietly outperformed.
Let’s take a closer look at how both asset classes stack up and why the best portfolios often blend the two.
What the numbers say
According to the Canadian Home Price Index (HPI), home prices have grown at an annualized 5.2% over the past 20 years. But for investors, real estate returns aren’t just about appreciation. Rental income can significantly enhance total returns.
To illustrate this, we modeled three scenarios based on different rental outcomes and compared them:
- Scenario 1: Owner-occupied with no rental income as the base (total return: HPI of 5.2%)
- Scenario 2: HPI plus a 2% net rental yield – reflecting an average rental market (total return: 7.2%)
- Scenario 3: HPI plus a 4% net rental yield – typical of a hot rental market or a property with lower costs (total return: 9.2%)
These figures represent total modeled annualized returns since 2005, combining both home price appreciation and net rental income. Let’s compare them to equity markets over the same 20-year period:

Whether you live in it or rent it out, real estate has its advantages. Yet the stock market offers compelling benefits that are difficult to ignore. The S&P 500’s 11.1% annualized return significantly outpaces even the most optimistic real estate scenario of 9.2% (HPI + 4% rental yield). This difference compounds over time, leading to much greater wealth accumulation for long-term investors.
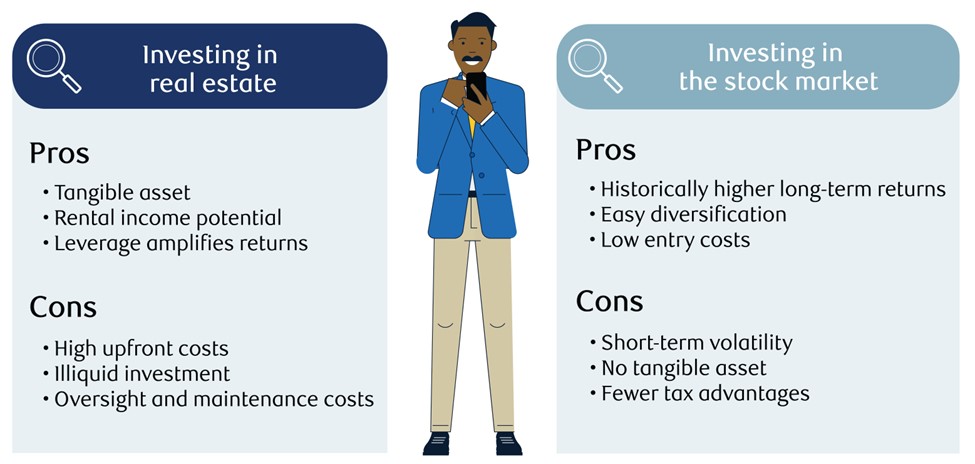
Pros and cons, side by side
When comparing two very different investments there can be a lot to think about. With respect to the market returns discussed above, here are some additional factors to consider:
What the market tells us now
Real estate has had an exceptional run over many decades, driven by low interest rates, limited supply and strong demand. But in today’s residential markets, with interest rates elevated and affordability stretched, future gains may not match the past.
Equities, on the other hand, continue to be powered by earnings, innovation, and global momentum. Yes, volatility is a part of the journey, but for long-term investors, the trend has consistently been upward.
Key takeaway
Real estate builds stability. Stocks build momentum. The strongest portfolios know how to harness both.
If you value control, income and a long-term anchor, real estate can deliver. If you want growth, flexibility and scalability, equities are hard to beat.
In the Community
We are joining the RBC Race for the Kids again this year and running the event locally on September 22. This race is to help Sunnybrook’s Family Navigation Project for youth with mental health problems.
For those wishing to sponsor – here is the link.
2025 RBC Race for the Kids Toronto RBC Silo: Ms. Karen Robertson - RBC Race for the Kids
Team News
Our office and the TSX is closed on Monday August 4.
Enjoy your Natal Day long weekend!