
Key Takeaways:
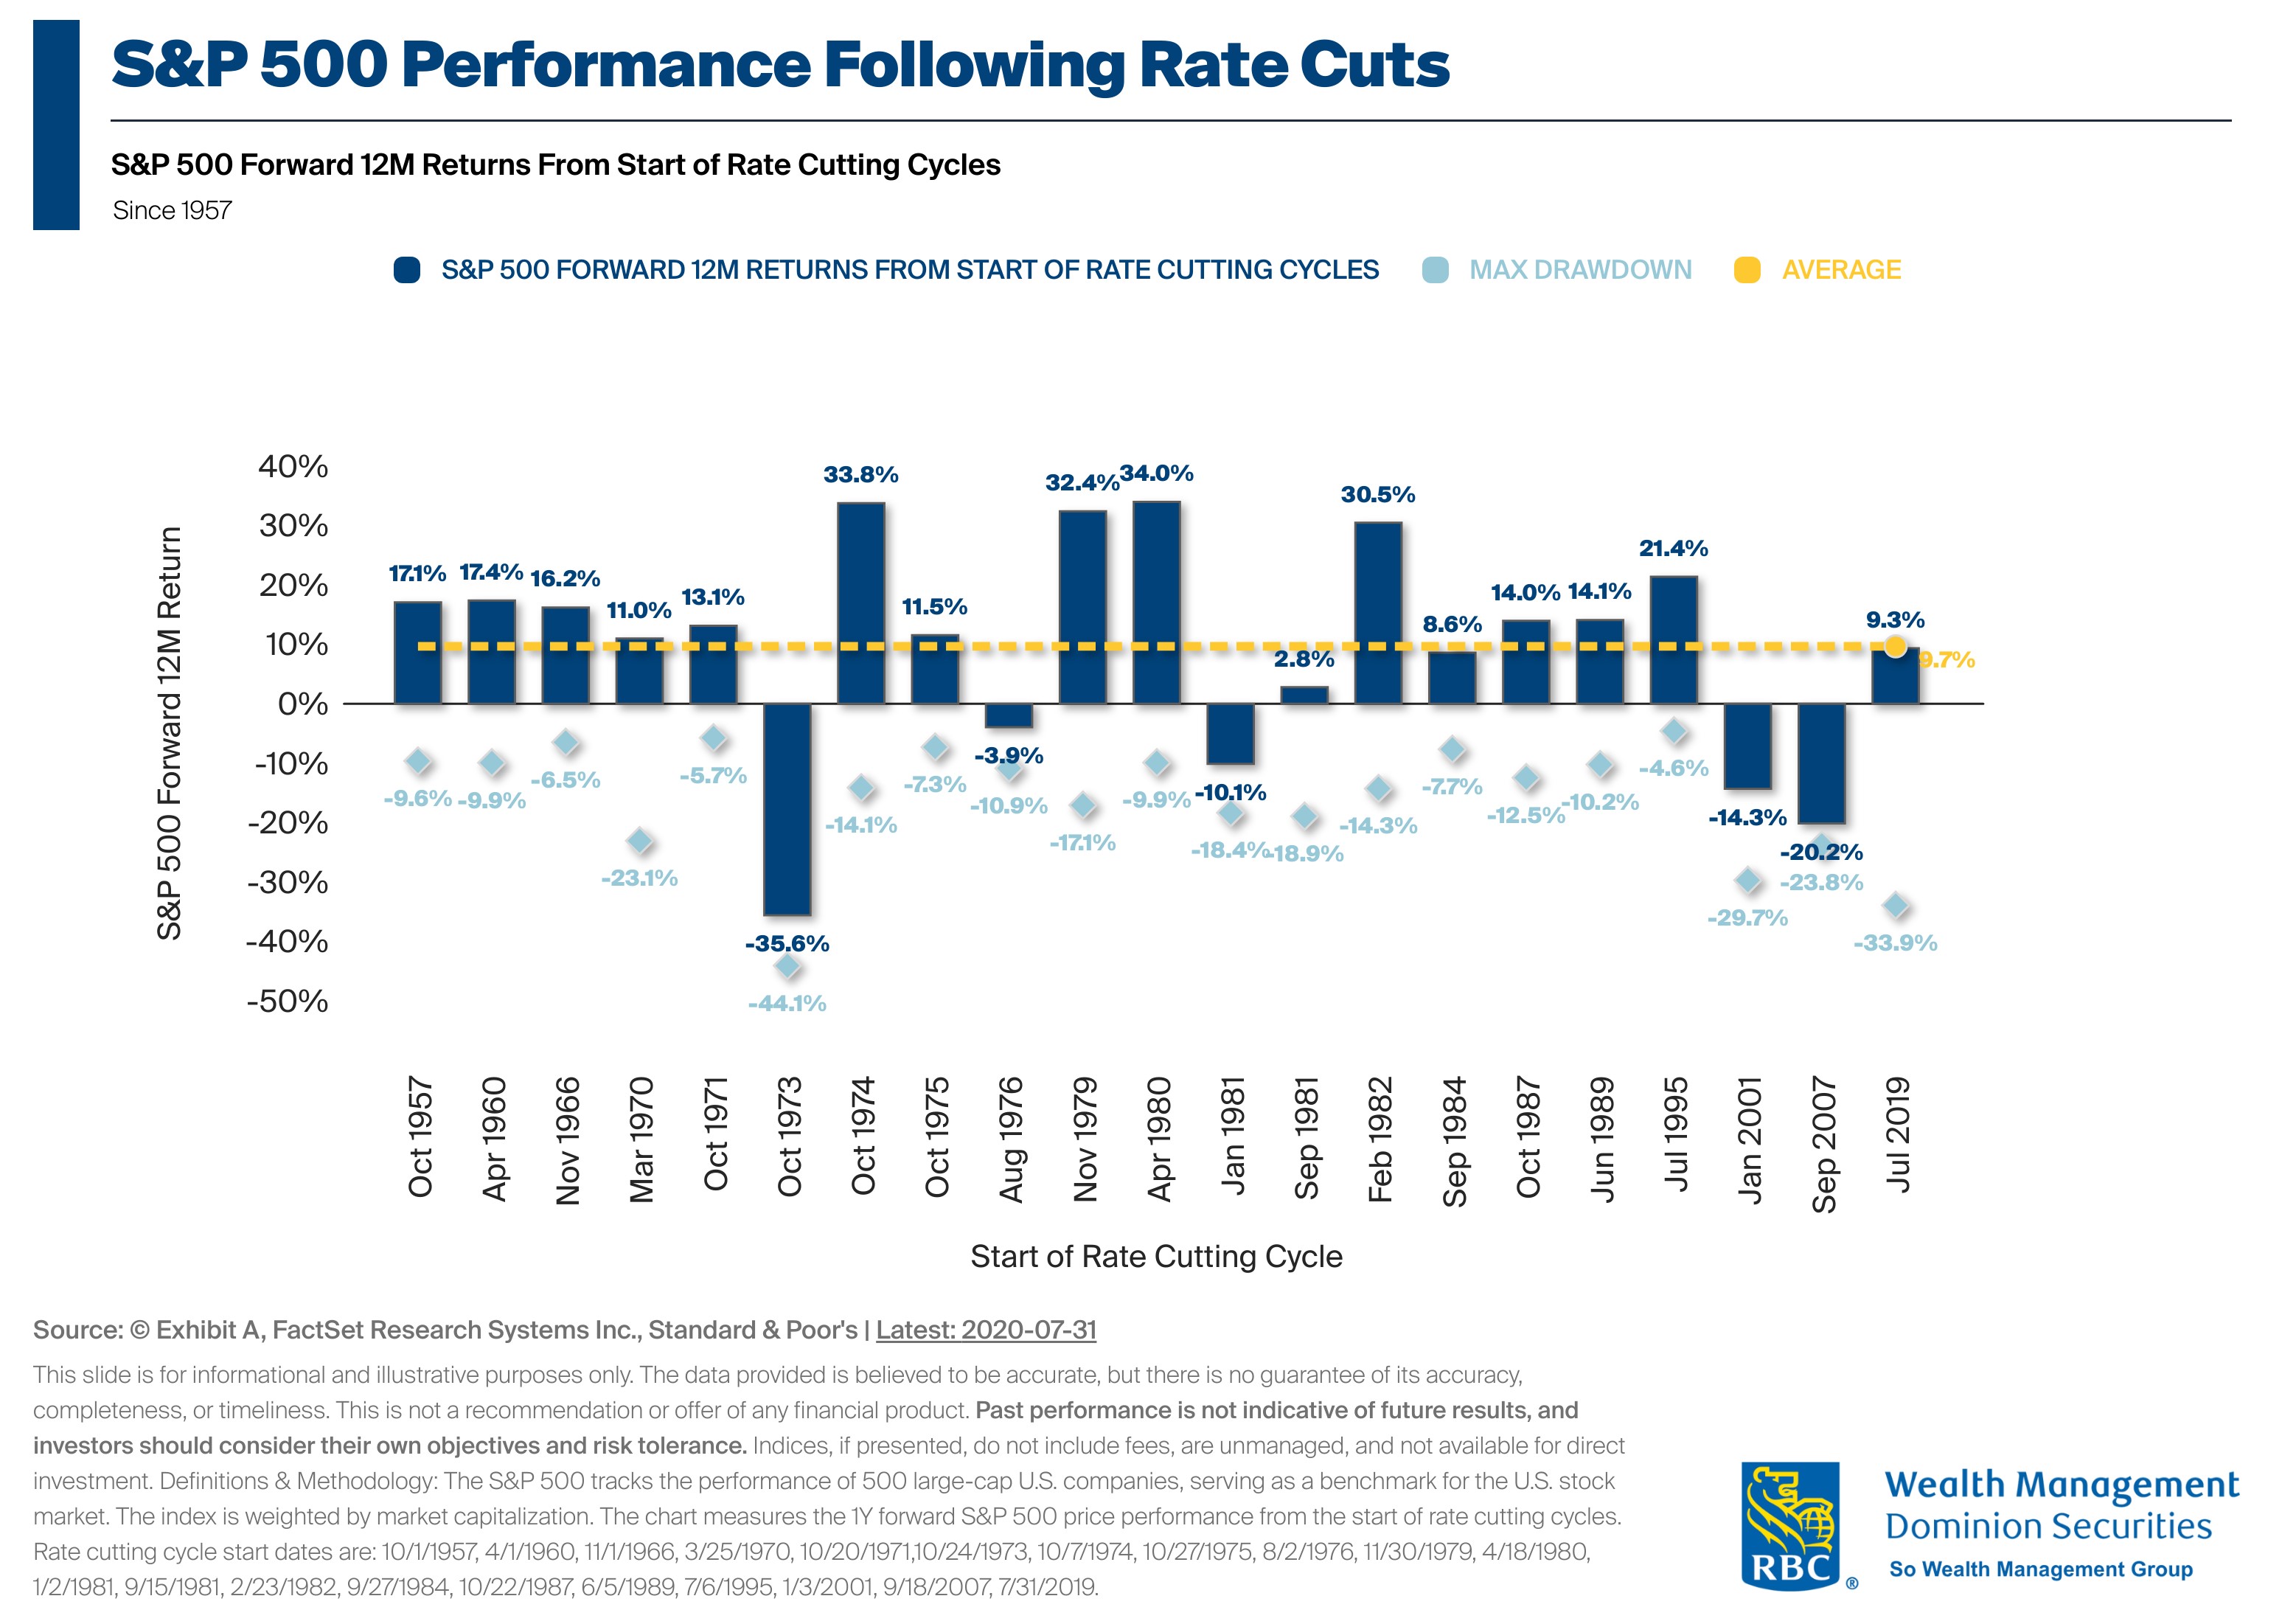
What Do Rate Cuts Mean For The Stock Market? The chart shows S&P 500 performance in the 12 months following the start of Fed rate cutting cycles since 1957. While individual outcomes differ by cycle, rate cuts have historically coincided with near double-digit 12 month forward returns, on average.
A Look at the Data: Across all cycles, the average 12-month return following the first rate cut has been +9.7%. Results range widely, with some periods delivering strong gains and others showing declines.
Investment Implications: History suggests that rate cuts do not guarantee higher returns, but they have often been followed by positive market performance on average