
Key Takeaways:
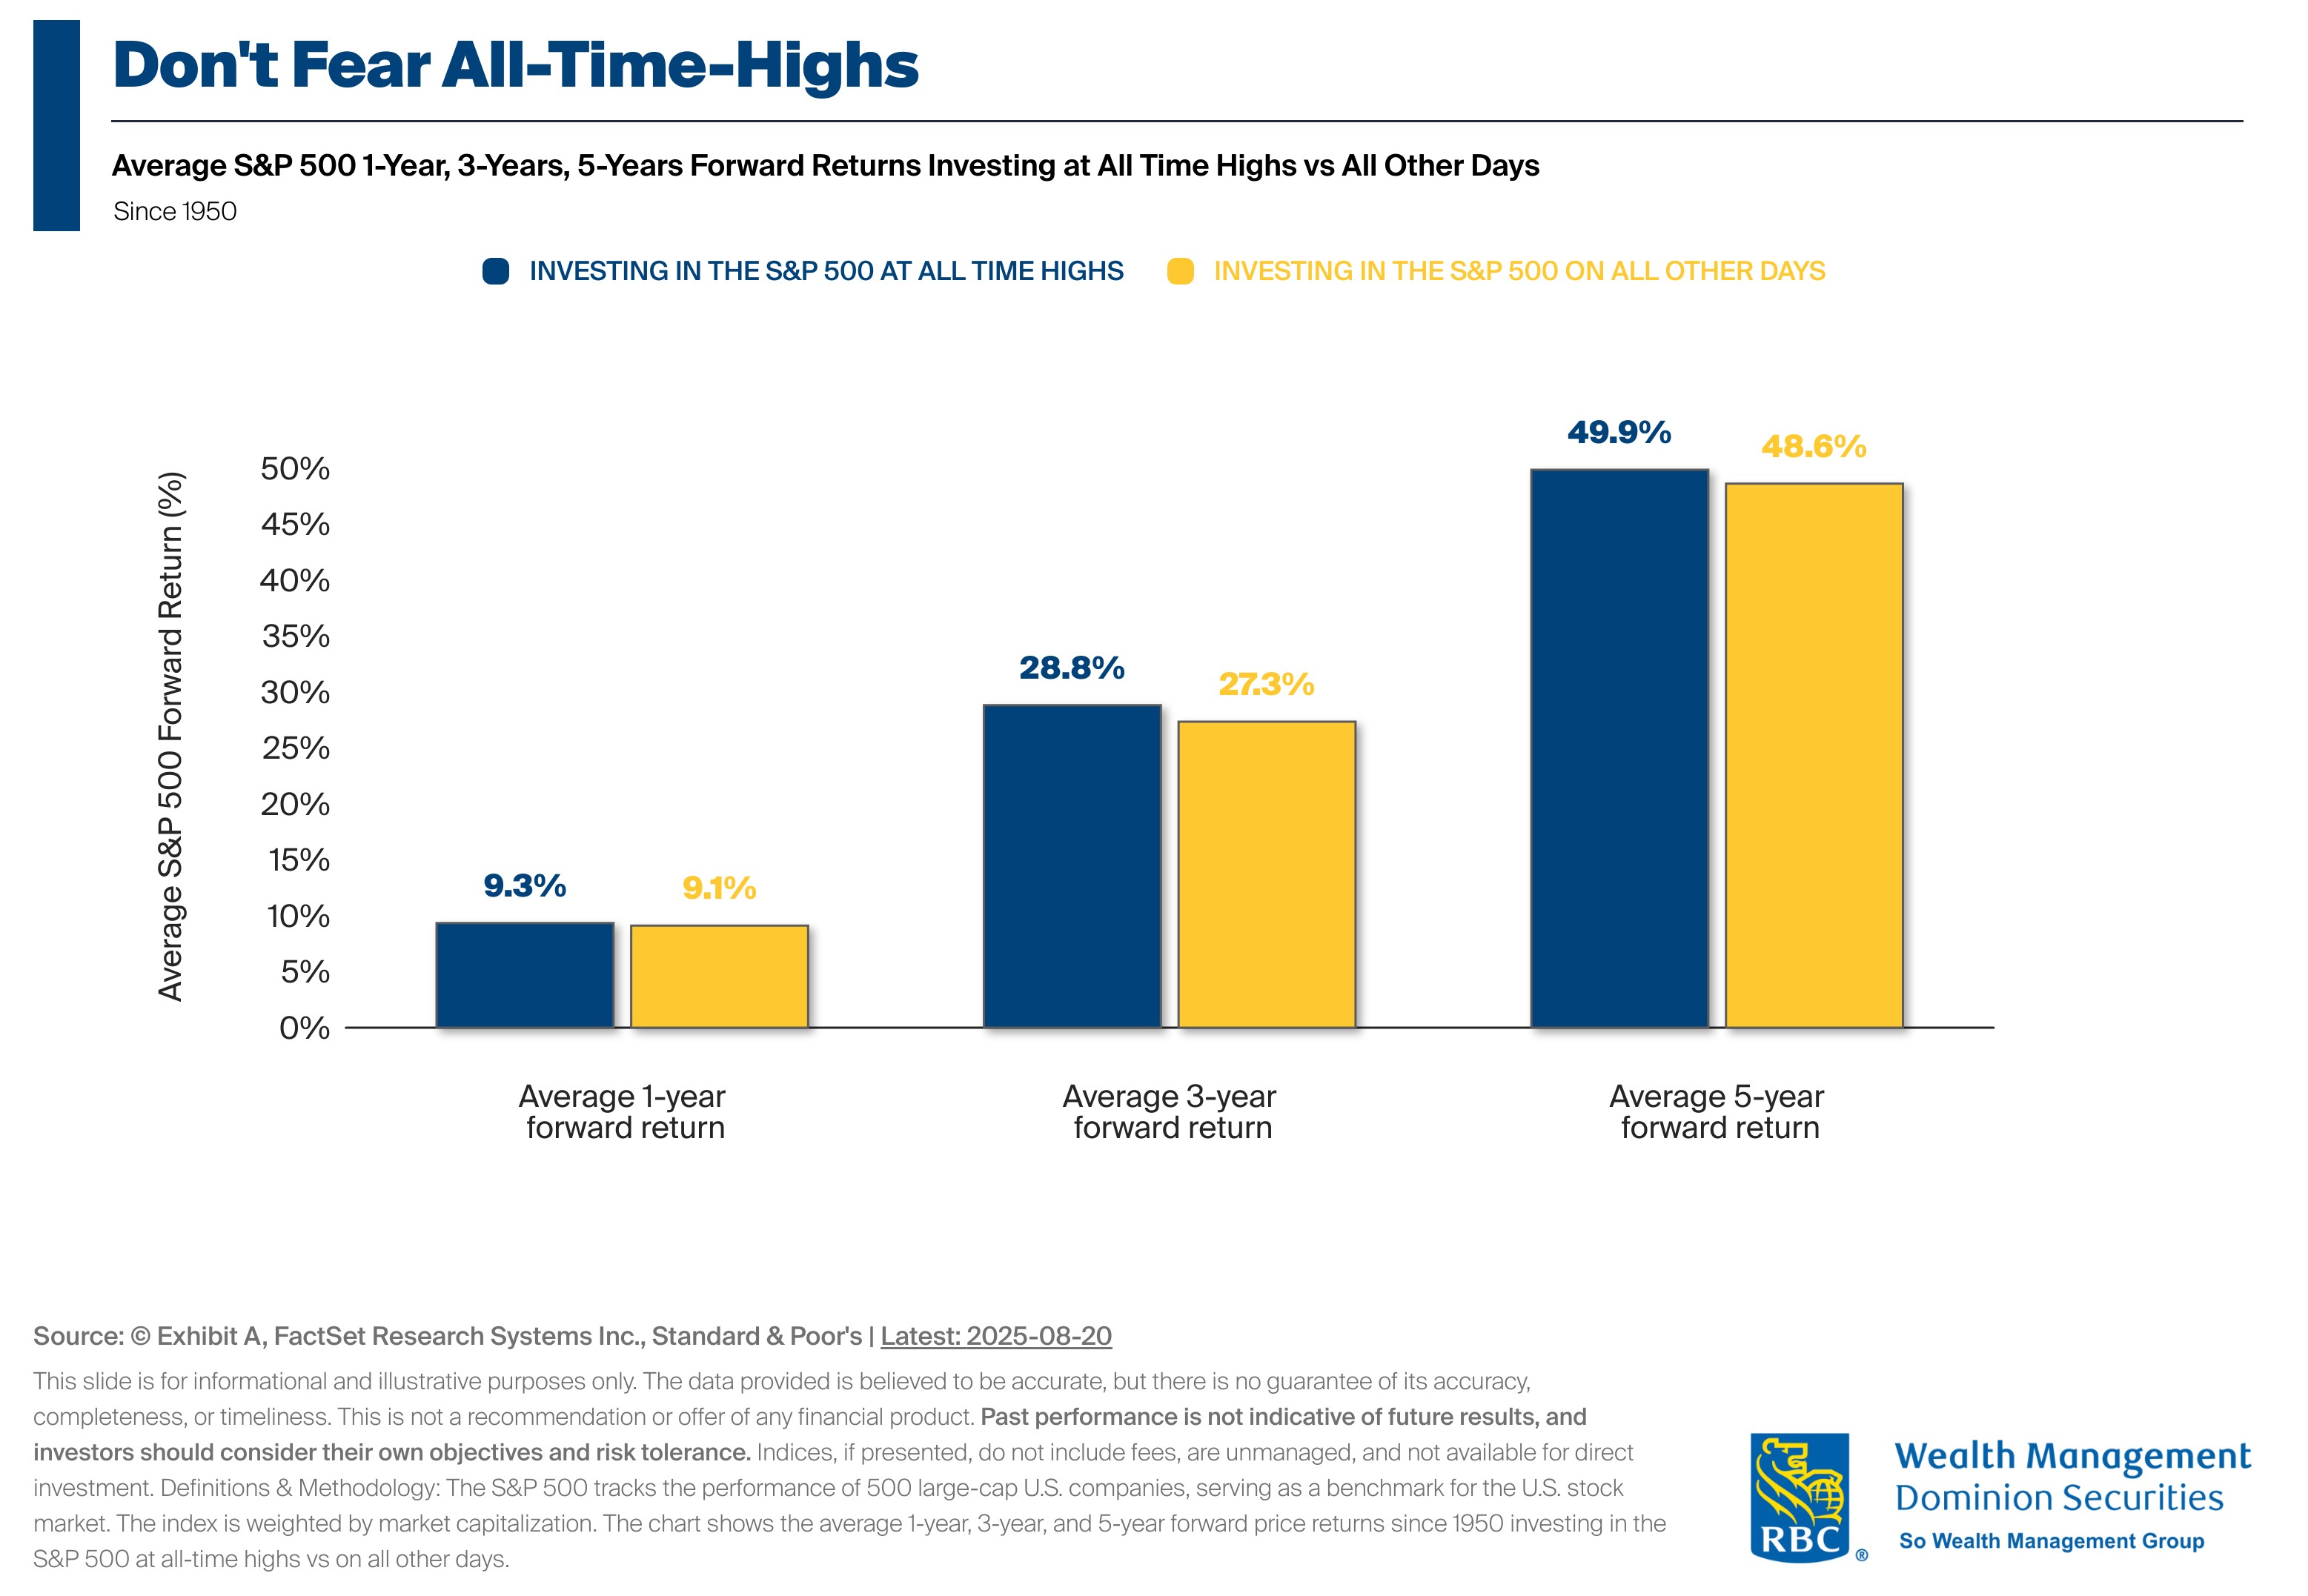
All-Time Highs Do Not Signal a Market Peak: The chart compares the average forward returns for the S&P 500 over 1-year, 3-year, and 5-year periods when investing at all-time highs versus all other days.
A Recent Look at the Data: The historical data illustrates that average forward returns on a 1-year, 3-year, and 5-year basis are higher at all time highs in the S&P 500 vs all other days. For example, the average 5-year forward return from all time highs (since 1950) is 49.9%. This compares to a lower average 5-year forward return of 48.6% investing on days when the S&P 500 is below all time highs.
Investment Implications: The takeaway for investors is that market all-time highs do not automatically signify impending market downturns. In fact, historical data shows that investing during these periods has been followed by above average returns on a 1, 3, and 5 year go-forward basis.