
There is something about the term “All Time Highs” that can make investors nervous. The phrase, “What goes up must come down” can be persuasive, illustrated clearly by the basic law of gravity. That said, “All Time Highs” in-and-of-itself are not the causation of pullbacks. In all likelihood, since stocks tend to go up over the long run, the most recent high won’t be the last.
Not as Special as you think
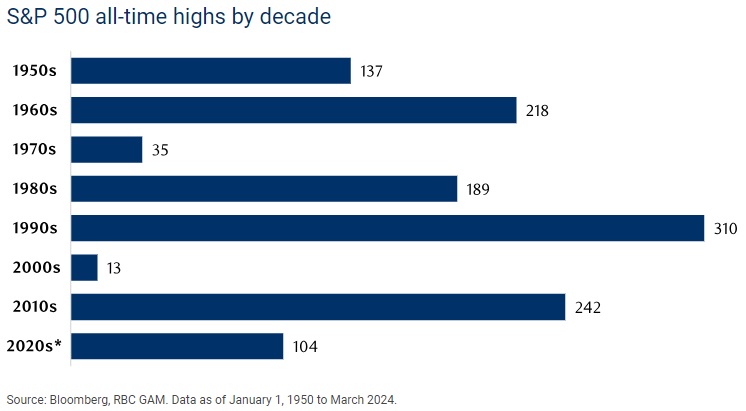
All-time highs are more common than one may realize. As illustrated in the chart below, since 1950, the S&P500 has set 1,250 all-time highs. This equates to an average of 16 highs every year. Although the 1970s and early 2000s experienced less robust growth, other decades have shown hundreds of highs signaling that strong markets often begets stronger markets. Thus far the 2020s appears to be off to a good start.
Investing at All-time Highs
Stock markets always reserve a right to pull back; however, as stated above, the reason itself is unlikely due to all-time highs. Rather, rising stock markets often reflect strong earnings and economic growth expectations. Hence, it may be (but shouldn’t be) surprising that the 1 year average and 3 year average returns for investing at all time highs have been 11.2% and 10.9% respectively.
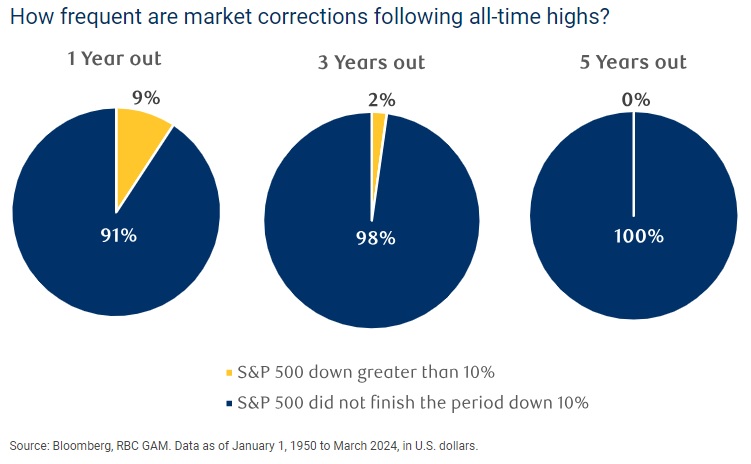
Investor nervousness at highs usually stems from the fear of paying a price that no other investors has paid, only to see the market fall into a correction. That said, market corrections following an all-time high are historically rare. The chart below shows how often the S&P500 has finished lower by 10% over the various 1,250+ all-time highs.
All time highs can be psychological barriers for both those who are invested and those who missed the upturn and looking to re-enter. With the historical data above, we believe long term investors should view their time horizon as an advantage. After all, new highs are normal occurrences and being invested may be the only way to stick to one’s long term financial plan.