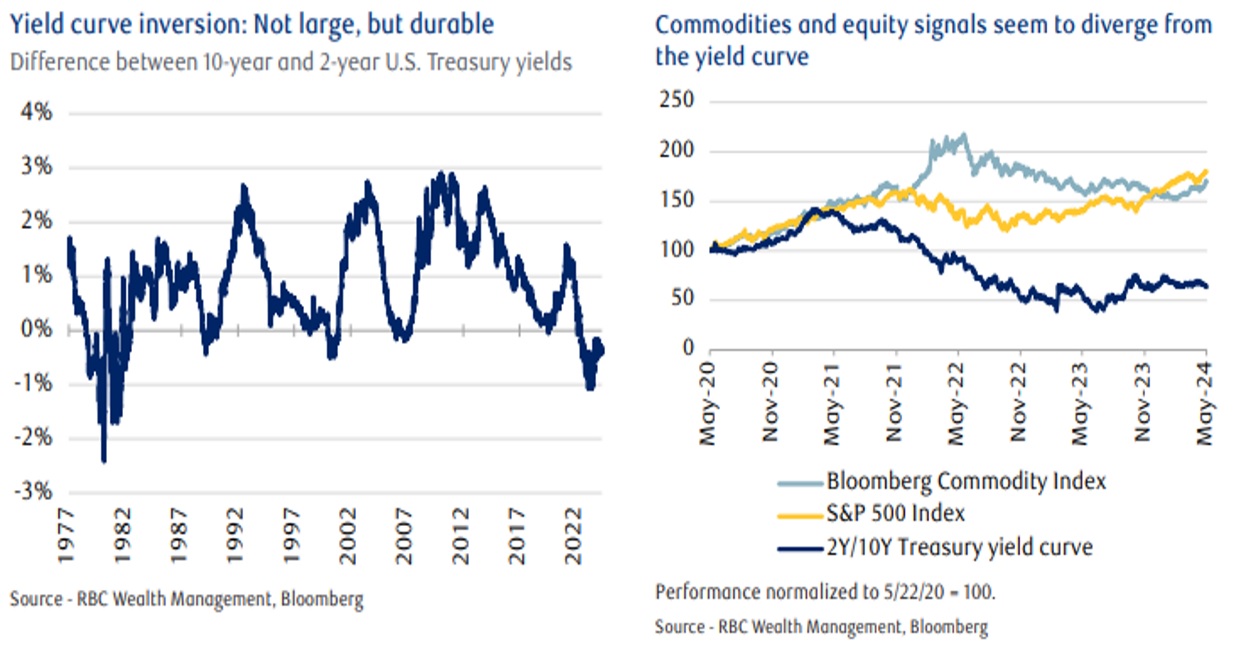
The ongoing yield curve inversion — a potential indicator of recession — appears inconsistent with the recent record highs of the equity markets. Traditionally, investors expect longer term bonds to offer higher yields to compensate for the greater uncertainty over time. This interpretation would reflect a “normal” yield curve. However, when shorter maturities offer higher yields, the curve is described as “inverted."
A common way to compare short and longer term maturities is by using the 2-year and 10-year Treasury rates. At the time of this writing, the curve is inverted by 45 basis points, with 2-year yields at 4.87 percent and 10-year yields at 4.42 percent. More significant than the size of this inversion is length of time it stays inverted. The current inversion has lasted nearly two years, surpassing the previous record of 623 days set in 1978 and greatly exceeding the average 92-day inversion over the past fifty years.

Yield Curve Inversions as Recession Indicators
Yield curve inversions are closely monitored as predictors of recessions. There are two main ways to link economic slowdowns with these yield differentials:
1. Monetary Policy: Slowing economic growth may prompt the Federal Reserve to lower rates. This can hurt investors in shorter-maturity bonds, who will face lower lower rates when it comes time for renewal. Consequently, longer-maturity bonds become more attractive. As demand for longer term bonds increase, their prices rise and yields fall. All together, this can lead to a yield curve inversion.
2. Cross Asset Class Performance: In a slowing economy, growth-oriented assets like stocks can struggle, while fixed income can offer more stable returns. This stability makes longer-term bonds more appealing during economic slowdowns. As demand for bonds increase, prices rise which results in lower yields and a possible yield curve inversion.
Shifting Perspectives on Inversion Drivers
Both explanations have influenced the current inversion. Over the past two years, private and public sector forecasters have perceived elevated recession risks, making longer maturities more attractive. Additionally, at times, investors had aggressive expectations for Fed rate cuts, especially to start this year. However, these factors seem less relevant now. Equity markets are at or near record highs, and growth-sensitive commodities, such as copper, have shown strong performance, inconsistent with expectations of a near-term recession or significant growth slowdown.
Earlier this year, interest rate futures priced in six to seven rate cuts, suggesting a straightforward path to curve normalization through Fed actions. However, projections have changed to expect fewer to potentially zero cuts. RBC Capital Markets, for example, anticipates only three rate cuts this cycle. Some Fed members have indicated that this rate cut cycle could leave rates higher than the post-global financial crisis norm, implying that short-term rates may not fall enough to normalize the curve.
Current Market Dynamics and Future Outlook
Despite signals of stronger growth and higher-for-longer short-term rates, 10-year rates have not risen as quickly as expected. The current bond prices imply that the yield curve could remain inverted for about two more years. One reason is the relatively high absolute level of bond yields. High-quality corporate bonds yield over 5.7 percent, and some municipal bonds offer tax-equivalent yields of nearly 7.5 percent, depending on an investor’s tax status. These yields can be attractive, particularly for the portion of the portfolio seen as a ballast against equities.
Recent Fed commentary has emphasized a high threshold for resuming rate hikes. At the same time, initial cracks in labor market data and financial pressures on lower-income households suggest downside risks to growth. Together, this provides enough incentive for investors to maintain or to continue building their bond positions. While risks around inflation and policy remain, today’s higher yields and economic trends might justify a price premium for longer-term bonds. Furthermore, the inverted yield curve suggests that the U.S. can comfortably fund its budget deficits in the near term, as investors are currently willing to pay a premium for longer-term U.S. bonds.
Conclusion
In summary, the current yield curve inversion reflects high economic uncertainty and the influence of government policy on short-term rates versus market-determined long-term yields. Despite the disruption of historical relationships, we believe that investors will eventually revert to demanding higher yields for longer maturities, normalizing the yield curve.
