
One of the most commonly asked questions among clients and professionals is whether we are in a bubble.
We know that high prices and rapid gains themselves do not define a bubble. After all, bull markets do not have expiry dates and stocks can persistently climb higher. It's also hard to definitively identify a bubble until after it has burst. Hence, a more productive exercise is to monitor valuations by comparing stock prices with company earnings and fundamentals.
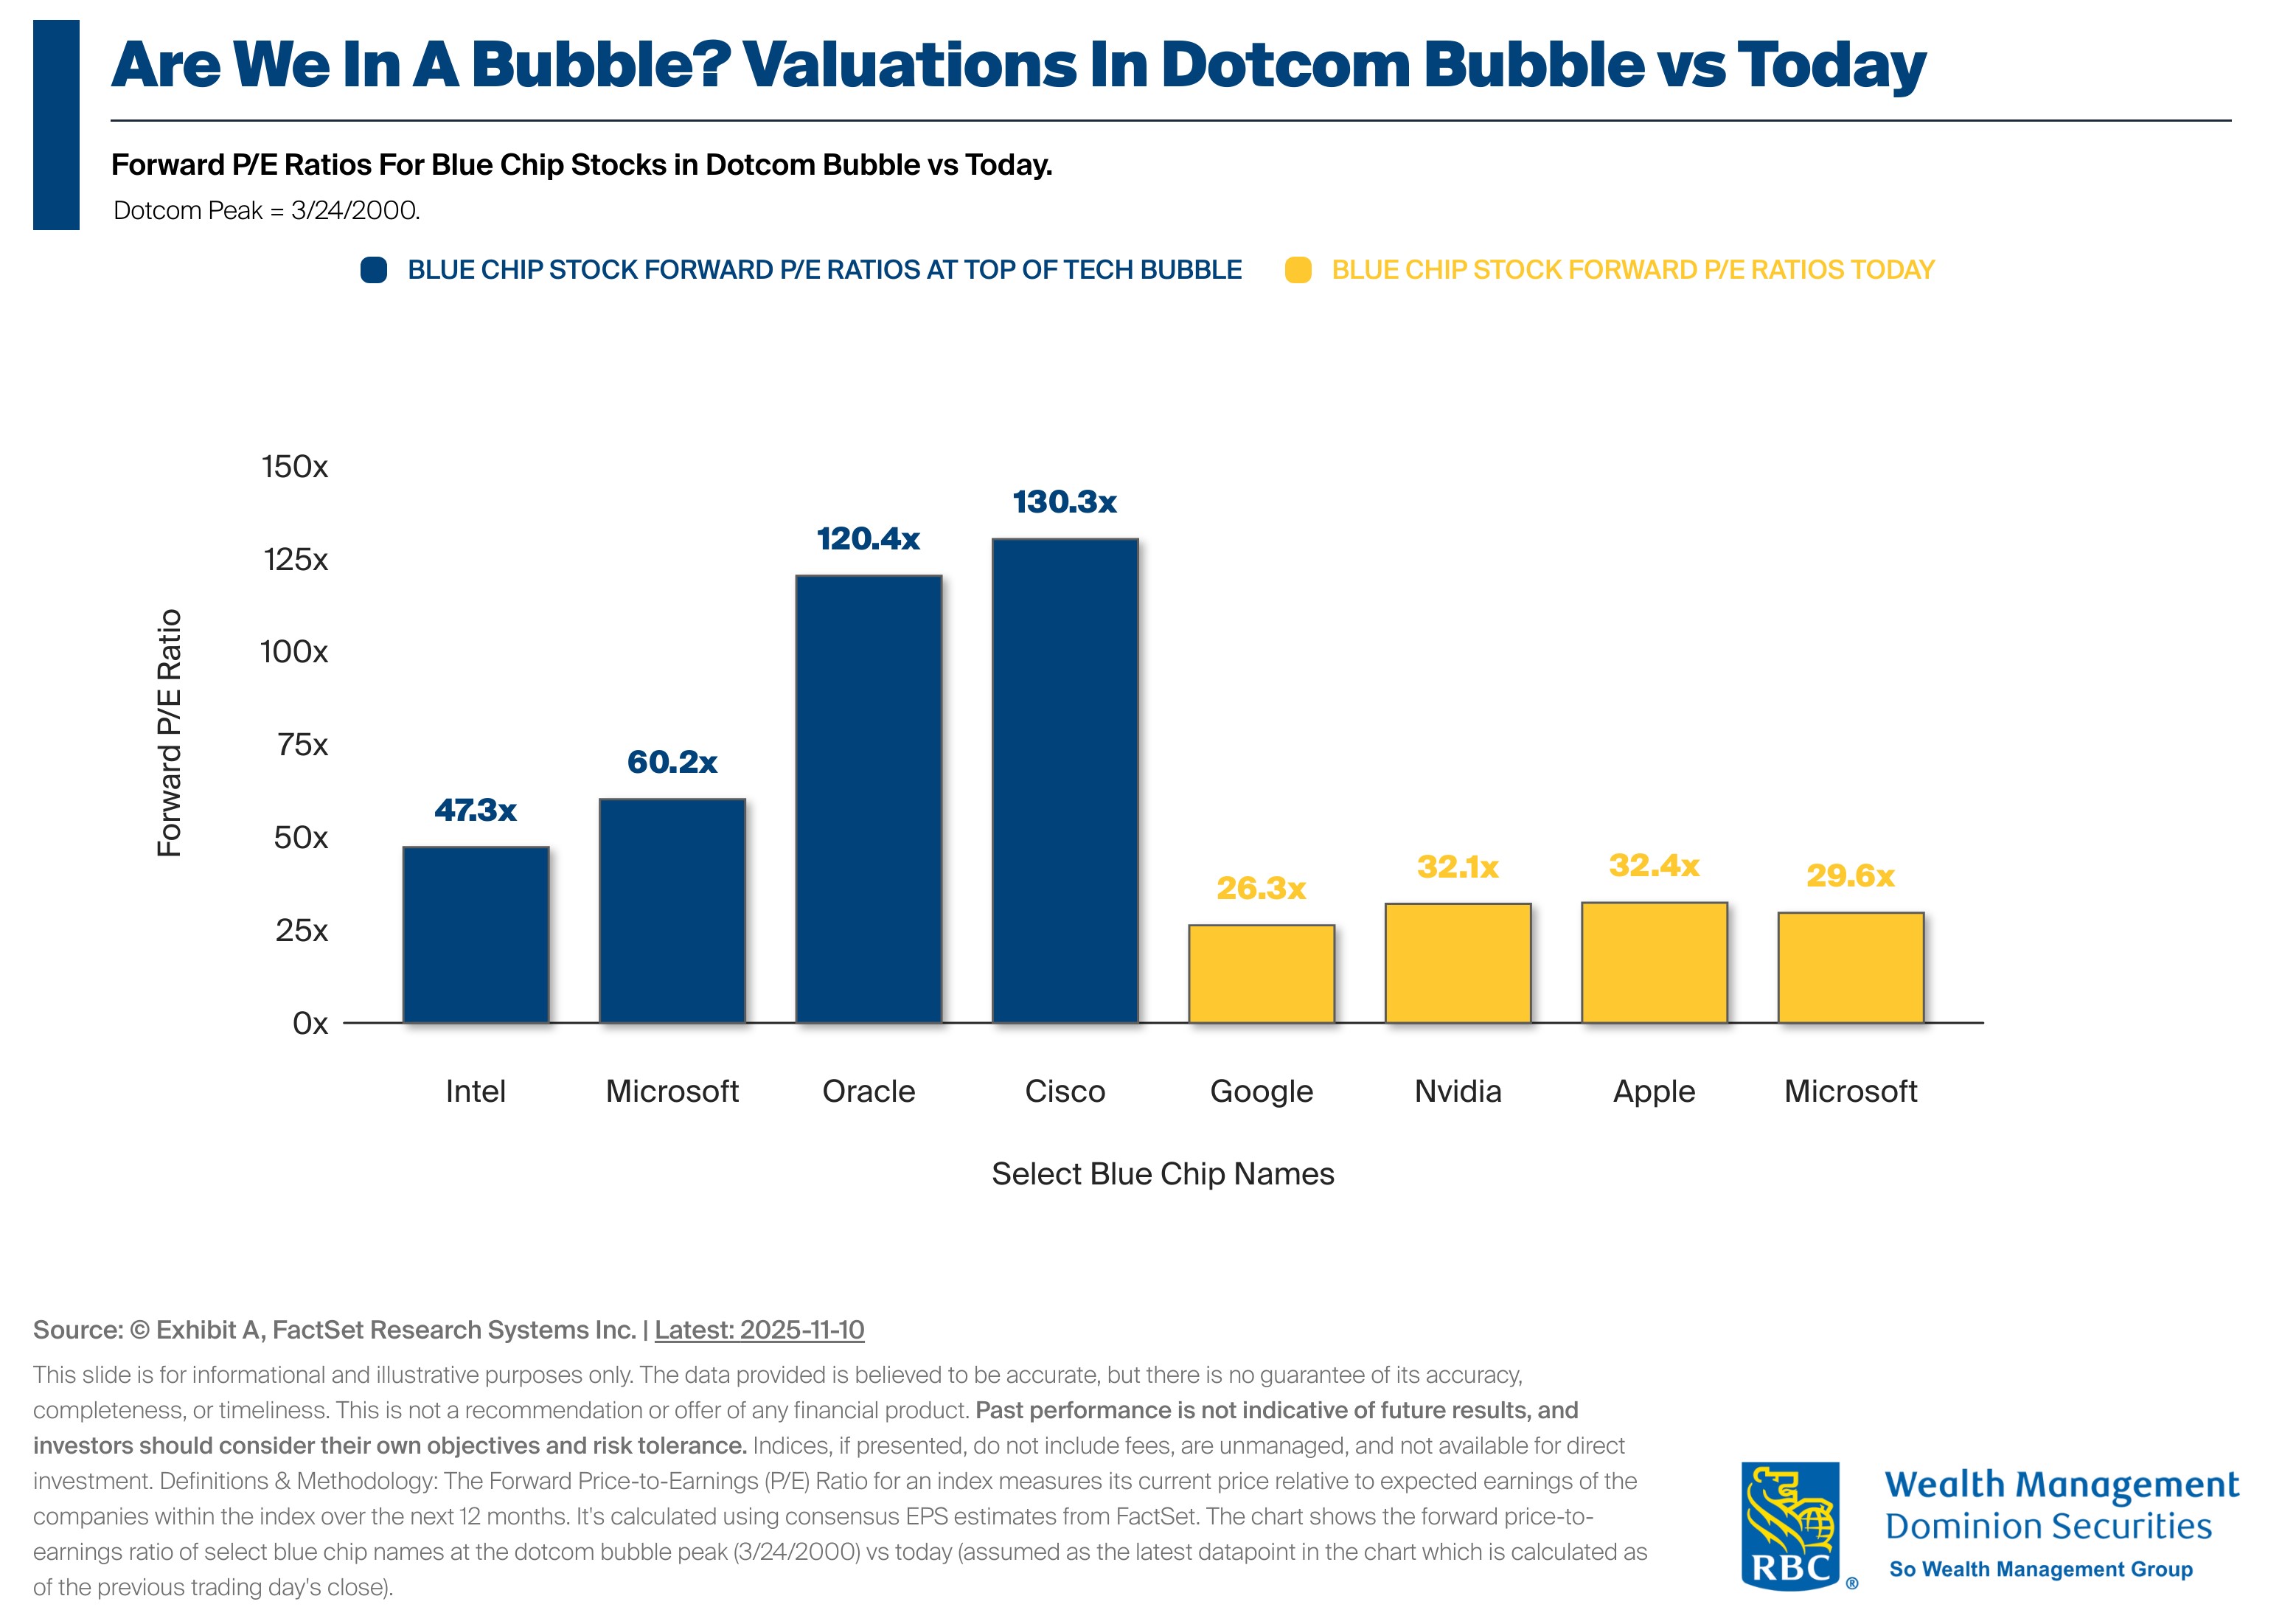
Valuations In Dotcom Bubble vs Today: The chart below shows the forward P/E ratios of select blue-chip names in the S&P 500 during the dotcom bubble compared with the heavy weights of today’s Mag-7 tech stocks.
Key Takeaways
A Look at the Data: At the March 2000 peak, leading tech names like Cisco and Oracle traded at extreme valuation multiples, with forward P/Es well above 100x. Today's largest S&P 500 constituents trade at far lower levels.
Investment Implications: For clients, the comparison highlights that while valuations have expanded, today's mega cap stocks are supported by stronger fundamentals, more diversified earnings, and greater profitability than during the 2000 cycle.
At the current valuation levels, investors should demand continued operational excellence and earnings growth from these companies. However, if using the 2000 tech bubble as a benchmark, we will need a greater degree of speculation and irrational exuberance from investors to make this a worthy comparable.