
The news cycle has been dominated by worrying headlines related to the debt ceiling and the impending threat of a recession. Investing in this environment can be confounding even for the most patient investors who trust that long-term investing in high-quality companies will yield positive results. When our team provides market commentary, it is often in the form of fundamental analysis. This attempts to put investing in the context of market valuations, earnings per share, potential growth rates, and the underlying trends within the broader economy. Another investment perspective that we write about less often involves Technical Analysis. Here, investors look through statistical prisms for patterns to foretell future price and volume movements.
Over the past few quarters, technical charts have pointed to signs that the worst might be behind us, and the longer-term uptrend is intact. The technical strategist at RBC Wealth Management believes the market lows that were established between Q3 and Q4 of 2022 should remain the lows for the current cycle. The chart below has two parts. The top panel shows a ‘momentum’ trend, and the lower panel shows the price level of the SP500. The momentum indicator suggests that the markets were oversold and bottomed out in Q4 2022. This was around the same time that the S&P 500 price level stabilized above the 4 year moving average trend line (red trend line). The blue-shaded area represents the longer-term uptrend band. The ability of the S&P500 to stay within this shaded uptrend band is an accomplishment that long term investors should take notice.
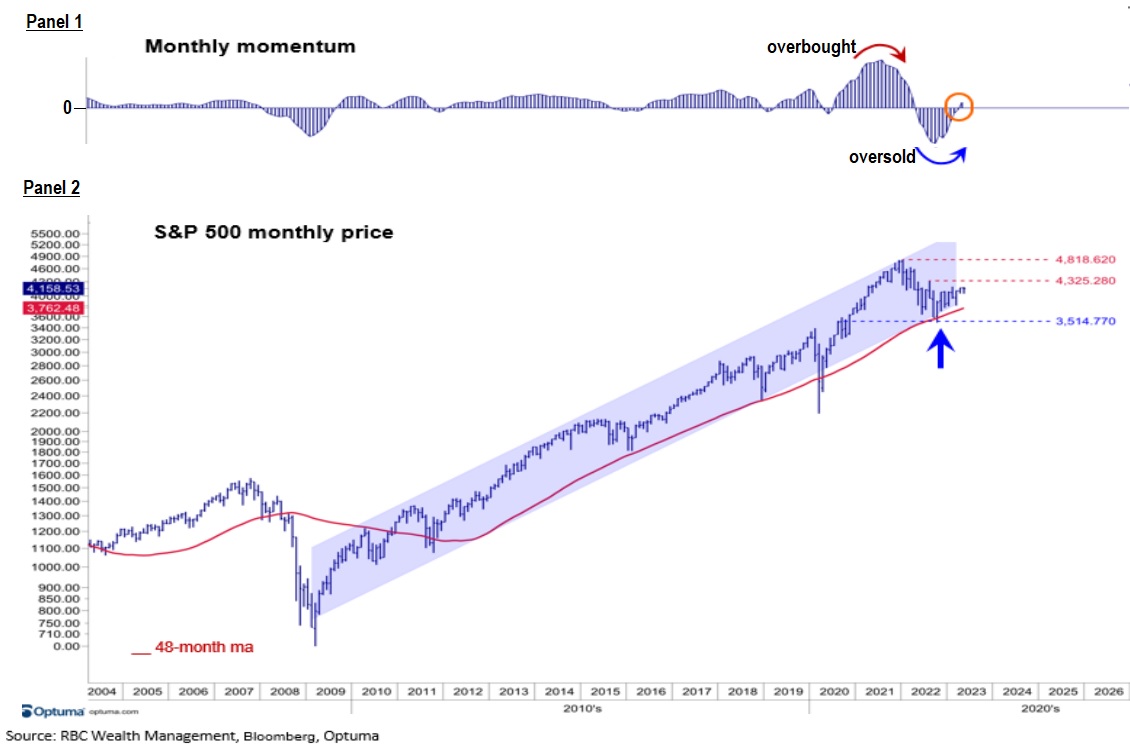
Furthermore, the momentum indicator has crossed above the zero axis. This is marked by the orange circle. This would suggest that the momentum trend has turned positive. However, the magnitude of the breakout is relatively small and new and, therefore, cannot yet be trusted. The technical strategist at RBC Wealth Management believes the SP500 will remain in a choppy sideways trading range through much of 2023, with 4200 and 4300 as important resistance bands. Should the trend line break through those levels, momentum, and volume may lift markets to loftier highs. Overall, with the technical backdrop improving, future pullbacks should not be the inception of a new bear market but could rather be a buying opportunity for longer term investors.