Gold: After the Rush
Every October, my house turns into a small, haunted carnival — three kids, too much sugar, and decorations that somehow outnumber the lights. Between pumpkin carving and costume negotiations, the chaos is pure fun. But Halloween, beneath all the candy, has always been about something deeper: confronting fear in a safe way.
Markets do the same thing. They build stories around risk and reward, dress them up in confidence, and then test how much fear investors can handle before they flinch. Gold, more than any other asset, has always lived at that intersection of fear and faith — a mirror reflecting what people believe about money, power, and permanence.
So when gold surged to US $4,398 per ounce this year — its highest price in history — only to tumble back below US $4,000 weeks later, it felt almost seasonal. A kind of market masquerade. What looked alarming in the moment was simply a mask coming off. The metal didn’t collapse because its logic failed; it corrected because momentum did.
Beneath the costume of volatility, the same timeless forces were still at work — debt, deficits, and doubt. And just like Halloween, when the lights come back on, we realize the things that spooked us weren’t imaginary; they were reminders of what’s real.
Let’s unpack that story in three acts.
Act I – The Rise: When Faith Met Fear
Gold makes its biggest moves during major regime changes. The oil embargo of 1970, Volker inflation era, the Plaza Accord, the Global Financial Crisis and QE, COVID and now Trump 2.0.
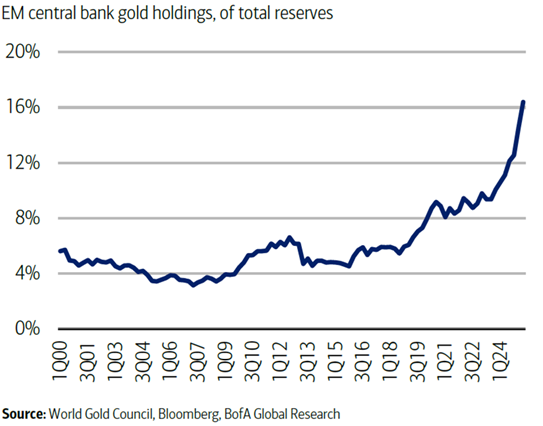
In 2016, central banks, particularly in Asia and the Middle East, started buying gold to bolster their reserves. In 2024, buying accelerated, reaching volumes not seen since the 1960s — nearly 29 million ounces a year, equal to about 20 percent of global supply. They weren’t speculating; they were diversifying away from paper promises. In a world where currencies could be politicized, gold is the one reserve asset with no counterparty.
Today, emerging market central banks hold over 16% of their total reserves in bullion.
Fiscal arithmetic enters the plot
As global deficits swelled, debt rolled into higher yields, and investors began to realize that “higher for longer” might be unsustainable when governments themselves were the largest borrowers. The cost of tight policy was becoming visible in the balance sheets of nations.
As confidence in permanent high real rates cracked, expectations shifted lower — and gold, which moves inversely to real yields, surged.
Finally, momentum took over. Record ETF inflows and hedge-fund positioning pushed prices vertical. What began as a slow, structural re-rating turned into a speculative sprint. The chart below shows the rapid assent in positioning of momentum traders in gold, cumulating in a +3 standard deviation move in J.P. Morgan’s momentum signal.
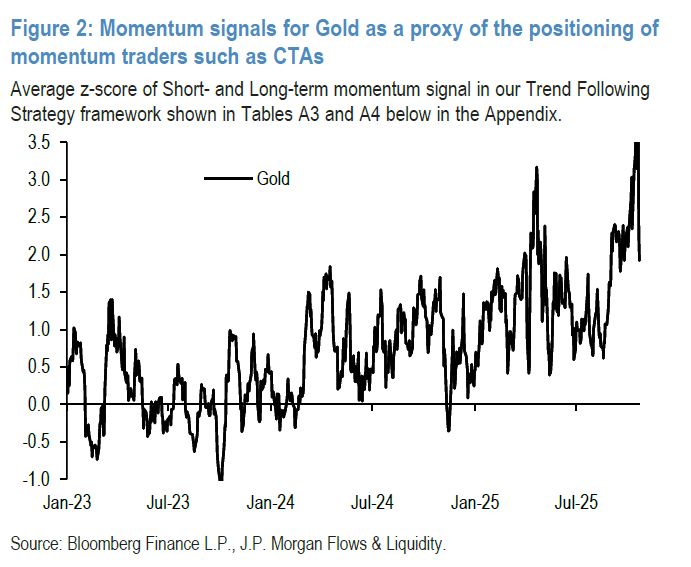
That was the setup for the reversal.
Act II – The Blow Off: When Momentum Met Math
By October 20th, positioning was stretched, sentiment euphoric, and everyone who wanted to own gold already did.
On October 21st, a stronger-than-expected U.S. jobs report and a firmer dollar gave momentum hedge funds the excuse to lock in gains, sending gold down 5% in a single session.
These corrections are part of every gold bull market — necessary, even healthy. They clear leverage and restore balance. What makes this pullback notable is how little the underlying story changed.
Central banks didn’t sell. Fiscal deficits didn’t shrink. Real yields didn’t sustainably rise. The structural demand that drove the rally is still there; it’s just breathing again.
Act III – The Aftermath: A New Normal
The consensus view now is remarkably consistent: gold has re-rated higher and is likely to stay there.
-
RBC Capital Markets sees a new floor near US $3,800, supported by official-sector demand and fiscal constraints.
-
J.P. Morgan expects gold to consolidate in the US $3,800–$4,000 range through year-end, then gradually climb toward the mid-$4,000s by late 2026.
-
BofA Global Research maintains a bull-case target of US $5,000/oz within 12–18 months, noting that the next leg will likely be steadier and more data-driven.
The common thread: the era of $2,000 gold as “expensive” is over.
We’ve entered a higher structural range — a reflection of fiscal strain, a more fragmented world order, and persistent central-bank accumulation.
In the 2010s, investors placed their faith in central banks. In the 2020s, they’re learning to hedge that faith.
Conclusion – A pause within the pattern
Gold’s path has never been straight. It runs, it rests, and sometimes it retreats before finding its footing again. That rhythm – of advance, pause, and renewal – is what defines its long-term character. The recent pullback fits within that timeless pattern: a moment of recalibration in an asset whose role has always been measured not in months or quarters, but in cycles and generations.
There is no certainty in investing, only probabilities.
What matters is not predicting the next move but understanding why we hold what we hold. We look to tilt the odds in our favor through consistent reassessment of markets, conditions and outlooks.
For years, we’ve maintained exposure to gold and silver in diversified client portfolios, complemented by ownership in Franco-Nevada, whose royalty-based model offers both leverage to the metal and downside resilience. These positions are not tactical trades; they are deliberate, long-term holdings designed to preserve purchasing power, diversify portfolios, and provide ballast when other assets falter.
We don’t chase glitter, we build value, one disciplined step at a time. If you’d like to revisit how gold or other alternative assets can fit into your investment plan, reach out.
Regards,
Marc Correia
References:
-
Bank of America - Gold: Overbought but underinvested (Oct 28, 2025)
-
JP Morgan - Flows & Liquidity: Gold as a hedge to equities (Oct 22, 2025)
Disclaimer
This commentary is based on information that is believed to be accurate at the time of writing, and is subject to change. All opinions and estimates contained in this report constitute RBC Dominion Securities Inc.'s judgment as of the date of this report, are subject to change without notice and are provided in good faith but without legal responsibility. Interest rates, market conditions and other investment factors are subject to change. Past performance may not be repeated. The information provided is intended only to illustrate certain historical returns and is not intended to reflect future values or returns. This information is not investment advice and should be used only in conjunction with a discussion with your RBC Dominion Securities Inc. Investment Advisor. This will ensure that your own circumstances have been considered properly and that action is taken on the latest available information. The information contained herein has been obtained from sources believed to be reliable at the time obtained but neither RBC Dominion Securities Inc. nor its employees, agents, or information suppliers can guarantee its accuracy or completeness. This report is not and under no circumstances is to be construed as an offer to sell or the solicitation of an offer to buy any securities. This report is furnished on the basis and understanding that neither RBC Dominion Securities Inc. nor its employees, agents, or information suppliers is to be under any responsibility or liability whatsoever in respect thereof. The inventories of RBC Dominion Securities Inc. may from time to time include securities mentioned herein. RBC Dominion Securities Inc.* and Royal Bank of Canada are separate corporate entities which are affiliated. *Member-Canadian Investor Protection Fund. RBC Dominion Securities Inc. is a member company of RBC Wealth Management, a business segment of Royal Bank of Canada. ® / TM Trademark(s) of Royal Bank of Canada. Used under license. © 2025 RBC Dominion Securities Inc. All rights reserved.