Going Full Banana
Forgive us – the first sentence is a doozy - How is it possible that a former Fox News host, who never met a G&T she didn’t like and who was too controversial for Fox News that they had to bench her post the 2020 Election for fear that they would be sued even more than they were sued because of her Election lies (when Fox News says “wait a minute, that’s not true”, you know we have reached a really big whopper), is now the U.S. Attorney for the District of Columbia, who is largely responsible for rooting out public corruption, and this was not even close to the most “banana republic” thing that the U.S. managed to do last week (exhale)?
How about moving convicted Jefferey Epstein co-conspirator Ghislaine Maxwell to a Federal country-club so she would not sing the body electric about a certain former N.Y. real estate magnate? That must be it, right? Getting closer – but still not quite full banana.
How about Texas trying to re-write election rules mid-cycle (as opposed to waiting until 2030 to cheat) in order to try to hold onto the GOP’s miniscule margin in the House of Representatives in the 2026 midterms? Getting very warm on the banana-scale, but as with most weeks – there is a Friday, and it was not until then that the U.S. chose to go “full banana”.
Full banana begins with someone who should really be the most boring person you have ever met. We are, of course, referring to Erika McEntarfer, who until Friday, August 1st was the Commissioner of Labor Statistics. Now, we have never met Dr. McEntarfer, so it is entirely possible she is not boring at all, but generally speaking – “mathletes” such as McEntarfer, are not known for their, umm, spiciness. Regardless, Dr. McEntarfer, who built an impressive near-20-year career in government, ascended to what for a mathematician and a statistician might have been the ultimate career achievement – overseeing the massive statistics problem that is the monthly U.S. jobs data.
Now, the monthly Non-Farm Payrolls (NFP) report is a statistical nightmare. The U.S. non-farm labor force is enormous – comprising ~160 million workers across ~33-million businesses and the government. Every month, ~130k of these businesses are surveyed along with various levels of government to get a statistical approximation of how many jobs were created in the previous month. To put the 130k in perspective – the Bureau of Labor Statistics (BLS) is essentially surveying 4 out of every 1,000 businesses in the U.S. to get an approximation of the number of jobs created in an economy of 160,000,000 workers. Needless to say – this data set is an inexact science that is subject to multiple revisions as more data comes in.
Until Friday August 1st, 2025 – most normally functioning humans either accepted the limitations of NFP or they went blissfully about their lives not really caring about NFP (we long to be in this latter group). But then Dr. McEntarfer made a mistake. No, she did not get the NFP numbers wrong – as we said, these numbers are inherently wrong because one is trying to estimate something massive from something small. Rather, Dr. McEntarfer, after receiving the statistical analysis from her team of likely very boring people, dutifully reported that the U.S. economy had created only 73k jobs in July and that the prior two months (May and June for those not good at calendar) were 258k lower than had previously been reported.
Now, 258,000 sounds like a lot, but it represents about one in every 600 jobs in the U.S. Further, given the general uncertainty that has existed since early April and so called “Liberation Day”, it is not at all surprising that participants in the BLS survey were sending mixed signals as to their hiring and firing intentions. But – when you go full banana, this sort of common sense does not matter – you reported news that was not good, and this can only be because you have an agenda. And so, perhaps for the first time in its history, the United States has seen fit to shoot the messenger, rather than the message.
The irony of the firing Dr. McEntarfer for reporting the facts as these facts would purport to give the current President exactly what he wants – lower interest rates. For months, another messenger – Fed Chair Jay Powell – has been under fire for refusing to cut interest rates. Chair Powell has argued that the inflation data remains worrisome and that tariffs have the potential to make inflation worse, not better. But the NFP data would appear to give Chair Powell some cover to start cutting rates as a weakening labor market is not only a part of the Fed’s mandate (seeking full employment), but also disinflationary (more available workers means less wage pressure). Of course, if the numbers are fake, as the firing of Dr. McEntarfer would suggest, then the labor market is not really weakening and thus rates should not be cut. But when you go full banana, the chess of it all gets lost in the checkers.
Bold-adjacent Predictions (Part II)
For Part I of our predictions, click here.
- Inflation is going to be an issue in 2026: assuming the U.S. doesn’t go full banana on the inflation data, there are some storm clouds forming that suggest inflation could be an issue as we get to the middle/back half of 2026. Let’s start with – the combination of mass deportations, tariffs and the resultant weaker U.S. dollar creates an inflationary backdrop. But even absent those forces, there are some indicators that are starting to flash yellow as to the future path of inflation. Let’s start with a chart and then comment:
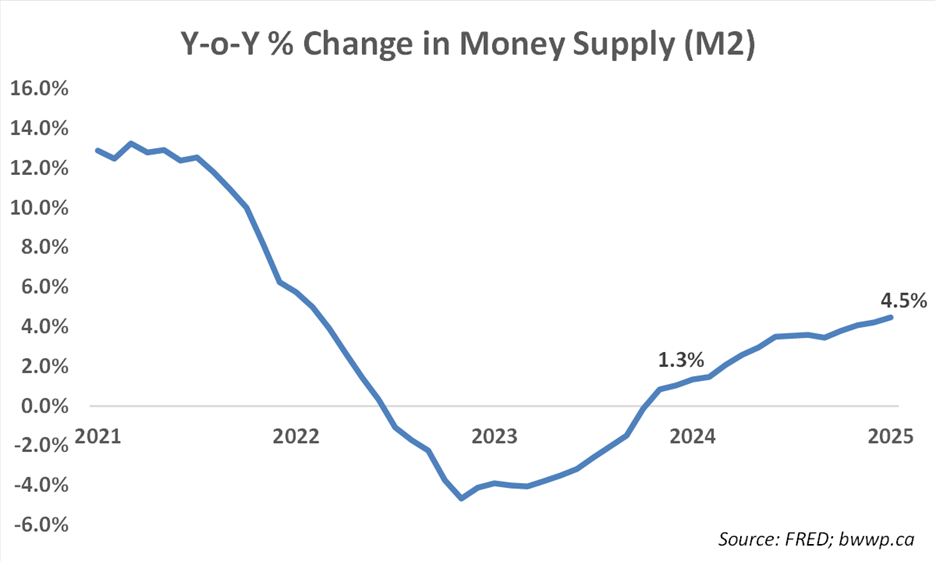
The U.S. money supply (as measured by M2) is surging at a clip of 4.5% year-over-year. A very basic rule of thumb might be if the money supply is growing at a faster rate than the economy (nominal GDP), the difference in the two would be inflation. However, a better rule of thumb might be – what does the rate of change look like today vs. a year ago? If the rate of change is accelerating – then you are likely to have inflation, while if it is decelerating, then you likely will not. As you can see in the above chart, M2 is currently growing at 4.5% y-o-y, while a year ago, it was growing at 1.3% - in other words, the growth in the money supply is a lot higher than it was a year ago and, in fact, is at its highest rate since mid-2022.
We should also add for those who might be asking – why is the money supply surging? Largely because loan growth has surged:
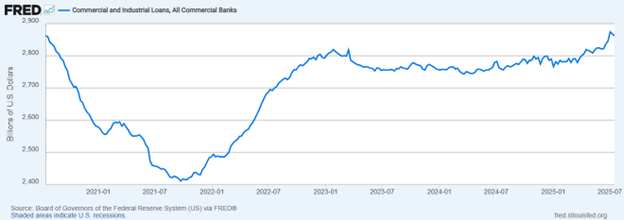
As you can see from the far right side of the chart, despite all of the uncertainty around tariffs, loan growth has surged in the early part of 2025. Loan growth feeds directly into M2 and is indicative that growth is likely to pick up (more investment means more growth).
Okay, let’s now add a chart that looks at the relationship between M2 growth and inflation. Not surprisingly, there is a lag between the two – in other words, you don’t juice the money supply and instantly get inflation, but rather, the transmission mechanism takes time:
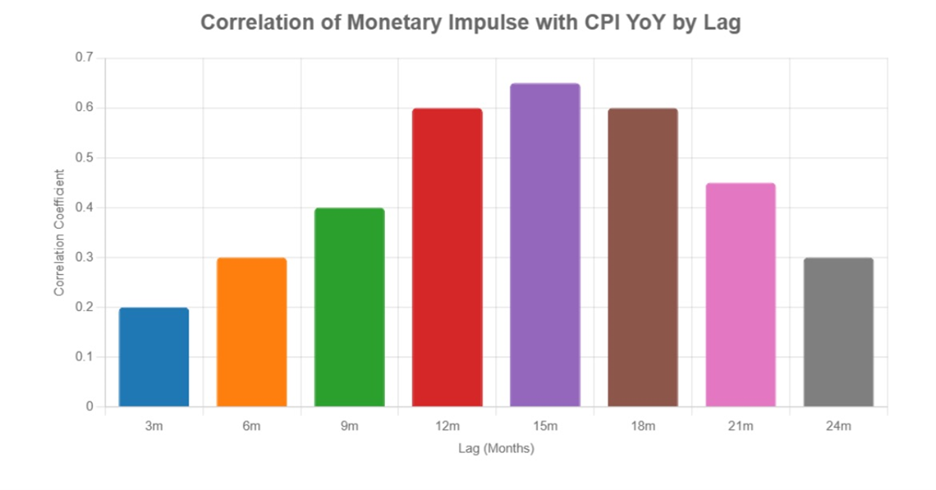
As you can see, the strongest correlation is at around 15-months. In other words, a change in growth rate of M2 (this is defined as The Monetary Impulse in the chart below*), would likely be reflected in inflation data sometime around September of 2026.
Okay, with that in mind, what is the Monetary Impulse predicting about inflation? Let’s look at a chart and then comment:

As you can see, current levels imply CPI of ~5% by September of 2026. Now, we would note that from 2005 through COVID, the Monetary Impulse tended to over-predict inflation, so this model has not necessarily worked throughout time. However, this makes sense as there were so many deflationary forces in the world, including China’s entry into the WTO, the Global Financial Crisis, massive amounts of Quantitative Easing, and massive growth in the labor supply through immigration. But since COVID, these forces have basically all flipped (plus we have tariffs now too) and thus it is not surprising that the fit has tightened considerably and, if anything, it has tended to under-predict inflation.
Bottom Line: Notwithstanding the desire to go full banana on inflation data, we think this is an under-appreciated risk as we get into the middle of next year. With U.S. growth likely to surprise to the upside (Prediction 1) and pressure on the Fed to cut rates (Prediction 2), we think the risks may be even greater than simply relying on a model such as the Monetary Impulse. As such, we are generally wary of longer duration bonds (maturities more than 5-7 years out) and do not want to get too far over our skis as it relates to stocks, as inflation shocks generally lead to increased volatility.
5. The Toronto Maple Leafs win the Cup: The last time the Leafs won the Stanley Cup, “Somethin’ Stupid” by Frank and Nancy Sinatra was the number one song in America. If this is not some sort of historical parallel to the present day, then there is no such thing as historic parallels (we grant that there may not be such thing as historic parallels). Anyway, we live in a time of “Somethin’ Stupid” so 59-years after the Sinatra’s crooned their way to number 1, the Leafs “get er done.”
6. The Canadian dollar remains rangebound: we have noted on several occasions that the Canadian dollar has had an unprecedented period of calm over the past decade or so. Let’s look at a chart and then comment:
.
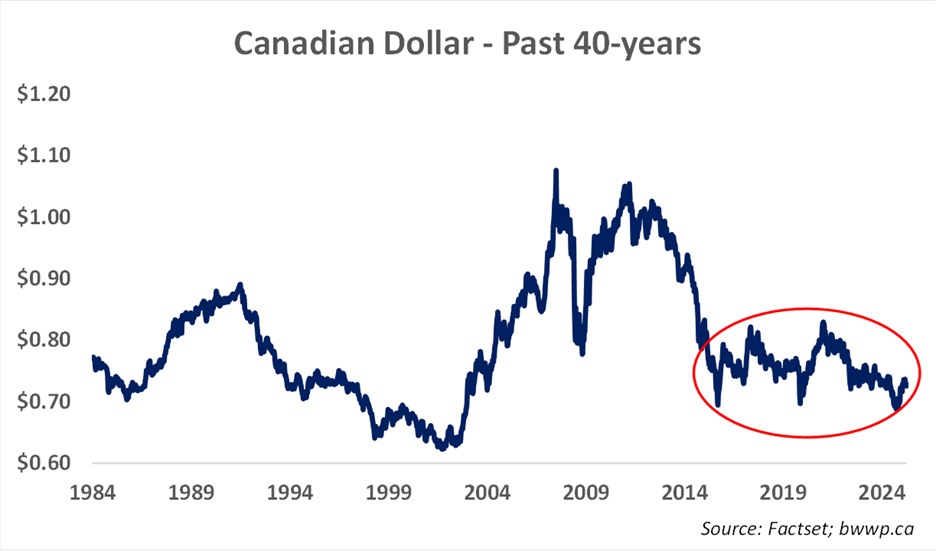
Over the last decade, the Canadian dollar has been between $0.70 and $0.80 more than 90% of the time. When one considers all of the events that have occurred over this period from negative oil prices during COVID to prices above $100/boe at the start of the Russia/Ukraine war; to tariffs and the resultant economic uncertainty; to COVID and the global uncertainty that it brought about, the “resiliency” of CAD is both impressive and speaks to a larger narrative – fair value for the Canadian dollar, despite some historic indicators that suggest otherwise, seems to have found an equilibrium relative to the U.S. dollar.
Now, we remain optimistic that Canada has finally started to get religion as it relates to some of issues that have weighed heavily on the economy over the past decade – a lack of domestic investment, a lack of foreign direct investment, too much red tape, over-reliance on the U.S. for growth – but this is a process that is likely to take years, not months, and thus we are confident that CAD is very likely rangebound in the $0.70 to $0.80 range with a bias toward the low-end of the range.
Next time: we will offer our final four predictions for the next 12-months with an aim of publishing by the end of August. Until then – enjoy your summer and stay sane.
*Note: Our comments surrounding the Monetary Impulse rely on the work of Danny Dayan, who is a macroeconomics writer and investor.