• The S&P 500 Index tracks 500 of the largest companies on the New York Stock Exchange (NYSE) and the National Association of Securities Dealers Automated Quotations (NASDAQ). At over $61 trillion in total value, the S&P 500 is considered to be one of the best gauges of US equities, and the American economy.
• In 2025, the S&P 500 maintained strong upward momentum (otherwise known as a “Bull market”) for a third consecutive year. It generated total returns of 17.9% in 2025 (including dividends), after advancing 25.0% in 2024 and 26.3% in 2023. In addition, 2025 marked the sixth year of double-digit positive returns over the past seven years.
The following chart displays every calendar year return from 1927 to 2025 from the best to the worst year of the S&P 500. We have highlighted the last four years of returns (2022 to 2025) to show where they rank among the best and worst years since 1927.
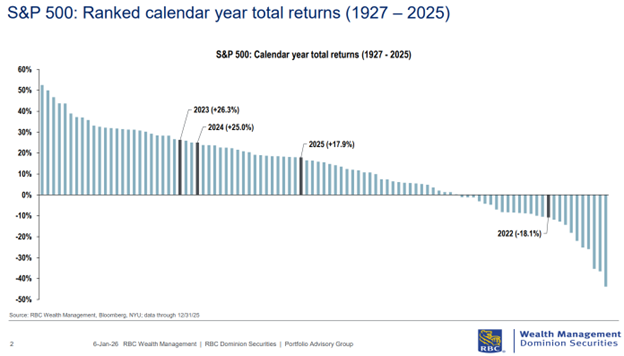
• The 17.9% growth for the S&P 500, in 2025, may seem abnormally strong, but history suggests it is more common than one might think. Since 1927, the S&P 500 has finished with a total return of 15%, or more, in 50 out of 99 years ― roughly 50% of the time. Far from an outlier, years of exceptional gains are a recurring feature of the market’s uneven performance from year to year.
• Since 1927, the average gain in an “up” year for the S&P 500 has been +21%, while the average loss in a “down” year over the same time frame has been -13%. Double-digit movements are more the norm than the exception for the S&P 500. In 72 of the past 99 years, the S&P 500 has ended the year with either double-digit gains (59 times) or double-digit declines (13 times).
• 2025 was the 73rd time (out of 99) the index has delivered positive total returns for a calendar year since 1927. While 2022 was a reminder that the S&P 500’s long-term upward trajectory can be interrupted by sharp corrections, the long-term trend for the stock market is usually upwards because the economy and profits grow over time. On a total return basis, the S&P 500 has been up in roughly seven of ten years since 1927. During these 73 positive years, the S&P 500 posted average returns of 21.3%, with roughly 80% of them reaching double-digit territory.
• After another strong year, some investors may be wondering what history says about returns after positive years. Encouragingly, history shows that upward momentum for the S&P 500 tends to carry forward. In the year after positive returns, the S&P 500 has advanced 11.4% on average and was positive 75% of time. When positive returns extend over three consecutive years, the fourth year has averaged a gain of 10.3% and has been positive about 67% of the time.
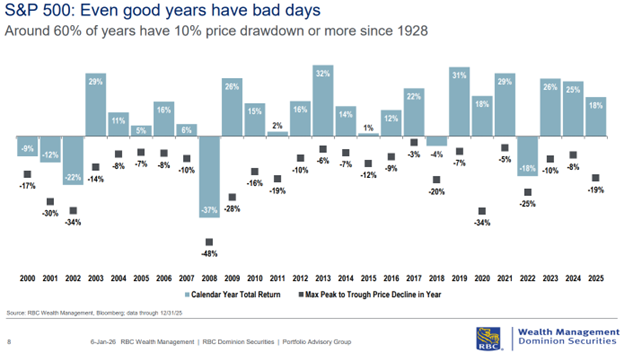
• Since 1928, the S&P 500 has experienced an approximately 16% peak-to-trough price pullback, on average during the year, with 62% of all years enduring at least a 10% intra-year price correction. Despite this volatility, however, the S&P 500 has delivered positive annual total returns roughly 70% of the time over the past 98 years.
Key takeaway: Corrections and volatility are normal features of equity markets, even in years when markets generate strong gains.
Here is a chart that shows the total annual returns and largest decreases within a given year since the year 2000. Note that within the year it is likely that we see a decline of at least -3% with an average intra-year decline of approximately -15.9%. Despite those intra-year declines, 20 of 26 (77%) of years posted positive total annual returns.
Thank you to Joseph Wu, CFA (Portfolio Manager, Multi-Asset Strategy), Nguyen Dang, CFA (Associate Portfolio Advisor, ETF), & Zach Muhn (Associate, Multi-Asset Strategy), of RBC Dominion Securities’ Portfolio Advisory Group, for sharing his research and content with me for my blog.
- Brad Weatherill