• The S&P/TSX Composite Index (TSX) tracks the largest 237 companies on the Toronto Stock Exchange, serving as Canada's main stock market gauge. At over $5 trillion in total value (as of December 31, 2025), it reflects economic health and is a benchmark for various Canadian sectors like financials, energy, and materials.
• Similar to most other major equity markets, TSX maintained upward momentum for a third consecutive year, generating total returns (including dividends) of 31.7% in 2025 after advancing 21.6% in 2024, and 11.8% in 2023. In addition, 2025 marked the 7th best year for the index since 1957 and the fifth year of double-digit positive returns over the last seven years.
The following chart highlights where the last four years rank in order of best to worst total annual returns for the TSX since 1957.
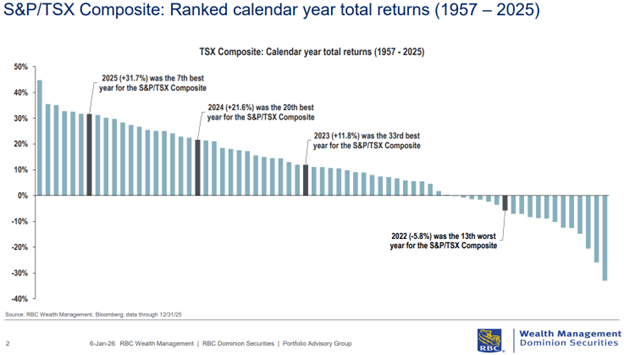
• The TSX was up 31.7% in 2025 inclusive of dividends. While such a performance may seem abnormally strong, history suggests it is more common than one might think. Since 1957, the TSX has finished with a total return of 20% or more in 22 out of 69 years – roughly 32% of the time. Far from an outlier, years of exceptional gains are a recurring feature of the market’s uneven performance from year to year.
• Since 1957, the average gain in an “up” year for the TSX has been +18.4%, while the average loss in a “down” year over the same time frame has been -9.8%. Double-digit movements are more the norm than the exception for the TSX: In 44 of the past 69 years, the market has ended the year with either double-digit gains (37 times) or double-digit declines (7 times), collectively accounting for around 64% of the time.
• 2025 was the 50th time (out of 69 years) the TSX has generated positive returns for a calendar year since 1957. Although 2022 served as a reminder that the TSX’s long-term upward trajectory can be interrupted occasionally by downside volatility, the long-term trend for the Canadian stock market, like its US peers, is usually upwards because the economy and profits expand over time. On a total return basis, the TSX has been up in roughly seven of ten years since 1957. During these 50 up years, the TSX has posted average returns of 18.4% (median: 17.4%), with almost 75% of them reaching double-digit territory.
• What does history say about returns after up years. Reassuringly, the historical track record shows that upward momentum for the Canadian equity market tends to carry forward. In the year after positive returns, the TSX has advanced 8.8% on average (median: 9.1%) and was positive 67% of time. When positive returns extend over three consecutive years, the fourth year has averaged a more modest 4.9% gain (median: -1.6%) and has been positive about 50% of the time.
• What about the history of 10%-plus years? Excluding 2025, the TSX has delivered 10%-plus total returns in 36 out of 69 years since 1957―roughly 52% of the time. In the year after a 10%-plus return, the TSX has rallied 10.2% on average (median: 9.5%) and is positive roughly 70% of time. In instances where the TSX posted total returns of more than 10% for three consecutive years, the fourth year has averaged 17.1% advance (median: 17.3%), with around 70% likelihood of a positive outcome.
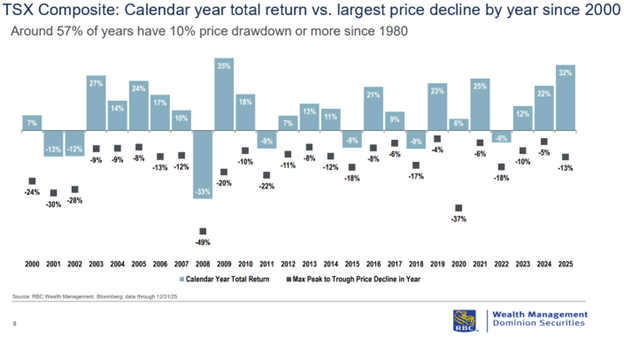
Here is a chart that shows the total annual returns and largest continuous decreases within a given year since the year 2000. Note that within the year it is likely that we see a decline of at least -4% with an average intra-year decline of approximately -15.7%. Despite those intra-year declines, 19 of 26 (73%) of years posted positive total annual returns.
Thank you to Joseph Wu, CFA (Portfolio Manager, Multi-Asset Strategy), Nguyen Dang, CFA (Associate Portfolio Advisor, ETF), & Zach Muhn (Associate, Multi-Asset Strategy), of RBC Dominion Securities’ Portfolio Advisory Group, for sharing his research and content with me for my blog.
- Brad Weatherill