
Strong bouts of equity market volatility usually don’t disappear overnight, and the current multi-month swoon is proving this to be the case once again.
While equity indexes attempted to stabilize early in the week, on Wednesday the S&P 500 and Dow Jones Industrial Average traded down 4.0 percent and 3.6 percent, respectively, the biggest single-session declines since Q2 2020 during the acute COVID-19 period.
High inflation, ongoing supply chain problems, and concerns about economic growth—along with wariness about the Fed’s ability to effectively right the ship—continue to weigh on the market.
But on Wednesday, for the first time during this lengthy selloff, these worries manifested in a big way on the corporate side, specifically within a major U.S. retailer’s quarterly earnings report.
Target missed its consensus earnings forecast by a mile and lowered forward earnings and profit margin estimates, sending the stock tumbling 25 percent in a single session, its worst day since Black Monday in 1987. The S&P 500 Retailing Index, which includes Target and 20 other major retailers, fell 7.4 percent in sympathy, and the rest of the market slid with it.
Earnings tripped up
Target’s news exacerbated concerns about the turbulent economic waters, and underscored that this is indeed a unique period with peculiar challenges that are well outside the scope of a normal business cycle.
With the Q1 earnings season just about finished, the S&P 500 has delivered much stronger earnings per share growth compared to the consensus forecast before reporting began (11.8 percent versus 4.7 percent) and higher revenue growth (13.8 percent versus 10.8 percent) on a year-over-year basis. Beat rates and the magnitude of surprises have been high. Also, profit margins have deteriorated less than initially expected (-3.0 percent versus -7.3 percent). Even when the ultra-robust Energy sector is stripped out of the data, both S&P 500 earnings and revenue growth are up 6.4 percent and 10.5 percent, respectively—not bad considering very lofty comparisons in the year-ago period. If one judged the quarter on these figures alone, everything would look fine.
But there is more to the Q1 earnings story as indicated by Target’s big miss and problems at retailers Walmart and Lowe’s, along with stumbles earlier in the reporting season by Texas Instruments, Alphabet (Google), Boeing, Whirlpool, JPMorgan Chase, Netflix, PayPal, Harley-Davidson, and Baker Hughes, among other firms.
Target’s situation is the most illustrative. The company blamed an unusual, rapid shift in customer spending from goods to services, which left it sitting on a mountain of household goods and apparel inventory that required extra warehouse space which came at a high price. The unwanted inventory prompted Target to discount a number of goods, much lower than usual—and despite this the company’s inventories are still bloated. Target also cited high fuel and freight costs as being problematic in Q1.
We think Target’s problems—and lesser but still meaningful struggles at Walmart—were exacerbated by supply chain and inflation challenges that began amid the global COVID-19 lockdowns and restrictions, and by households’ unique buying habits during that period.
After stimulus checks rained down from federal and state governments during the pandemic, American households bought goods hand over fist, including big-ticket items. Now that the stimulus checks and outsized goods spending have largely run their course, and with inflation taking a greater toll, household spending is shifting away from goods and toward discretionary services (including pricey airfares and hotels) and higher-cost basic staples such as food, gasoline, and utilities.
It could take a number of months for the economic imbalances to sort themselves out, and for companies and the market to absorb the shifts. Much will depend on how consumer and business demand respond to Fed rate hikes, and how long supply chains remain constrained and inflation stays “sticky.” The latter two challenges have become more complex lately due to the renewed COVID-19 lockdowns in China, problems with Ukraine’s agriculture supplies, and sweeping Western sanctions on Russia that have added premiums to commodity prices worldwide.
The economic imbalances and Target’s big miss are indications to us that the S&P 500 consensus earnings forecast of $227 per share for 2022 could be too high.
Bears on parade
Given these headwinds and with the S&P 500 down 18.2 percent from its peak in January, it should be no surprise that stock market sentiment has deteriorated significantly. Among individual investors, it recently declined to one of the most bearish levels in almost 35 years, according to a weekly survey by the American Association of Individual Investors (AAII).
The bull-bear spread, which measures the percentage of investors who are bullish about the market’s prospects for the next six months minus the percentage who are bearish, dropped to -31.7 in early May, on a four-week moving average basis. This means there were 31.7 percent more bears than bulls, which is the fourth-most-bearish low point since AAII began conducting its survey in mid-1987, as the chart below illustrates.
Investor sentiment has become very bearish, which is usually a contrarian indicator
AAII bull-bear spread* (4-week moving average)
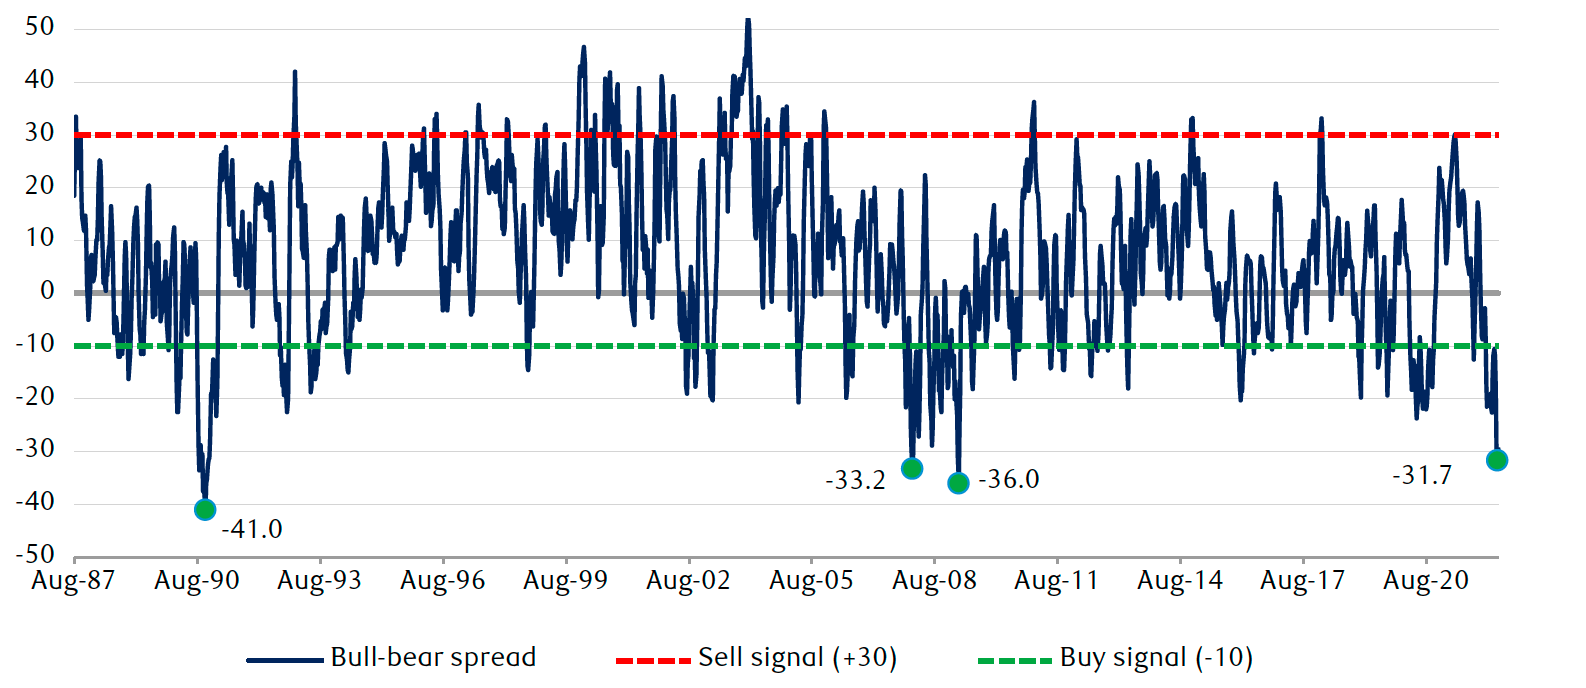
* The bull-bear spread is based on the weekly Investor Sentiment Survey by the American Association of Individual Investors (AAII) and represents the percentage of respondents reporting bullish sentiment minus the percentage reporting bearish sentiment.
Source - RBC Capital Markets U.S. Equity Strategy, RBC Wealth Management, AAII, Bloomberg; weekly data 8/13/87–5/19/22. The -31.7 data point is from 5/5/22; the most recent reading on 5/19/22 is -29.5.
It’s not just individual investors who currently have gloomy attitudes about the market. In recent weeks, sentiment of institutional investors (managers of mutual funds, pension funds, and hedge funds) has likewise fallen to very bearish levels based on a variety of indicators.
Ironically, with sentiment this negative, this is not the time to give up on the market, in our opinion. Extreme sentiment readings are often contrarian indicators for market performance. When investors’ attitudes are rather bearish, the market often rallies within a 12-month time span, and when attitudes are unusually bullish, the market typically stumbles soon thereafter.
An RBC Capital Markets study found that when the AAII bull-bear spread falls below -10, it is typically a short-term buy signal, whereas when the reading rises above +30, it is usually a short-term sell signal (these levels are shown by the green and red lines in the chart above). Specifically, the study reveals that since 1987 when the bull-bear spread fell below the -10 threshold, the market bounced soon thereafter and rose 15.5 percent 52 weeks later, on average.
The market tends to rise after sentiment becomes very bearish
Average S&P 500 return after the bull-bear spread is below -10*
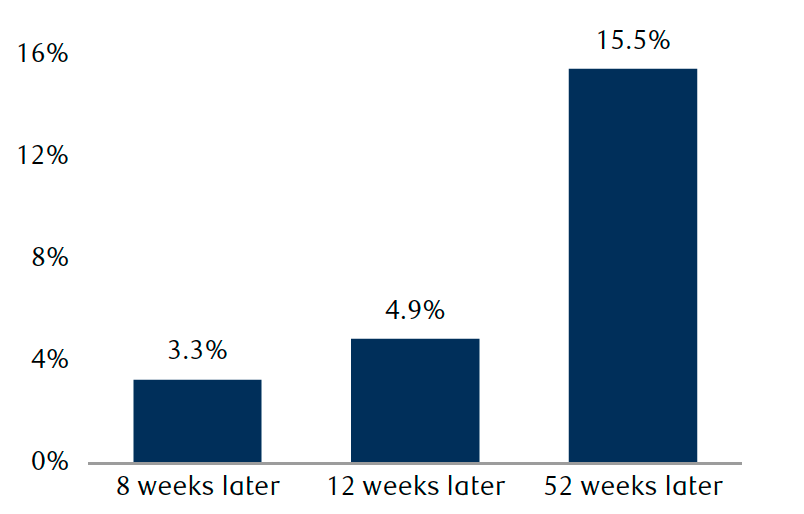
* Data represents forward returns when the 4-week moving average of percentage of bulls minus percentage of bears in survey results from the American Association of Individual Investors (AAII) is below -10; survey measures weekly sentiment data from 8/13/87 to 5/19/22.
Source - RBC Capital Markets U.S. Equity Strategy, RBC Wealth Management, AAII, Bloomberg
To us, the very gloomy attitudes about the market signal that even if volatility persists and there is additional downside in the near term, if history is a guide, the market has the potential to upend the majority’s expectations and deliver worthwhile gains within 12 months from now. This is one of the reasons we think long-term investors should stay the course. For additional factors, see our recent article, “Can this volatile stock market regain momentum?”