

I am a big fan of the Toronto Raptors and have been for years, although I did not want to admit that some years (cough, cough- Kevin O’Neill season). It’s been a nice ride these past few years as they have become one of the better teams in the league almost by accident. That translated to some playoff success but it became obvious to everyone that follows the team that they were losing in the end because they were horribly inefficient. Depending on 2 players and their scoring from 18 feet was not the most efficient use of their overall talent. Something had to change. Was it the personnel or the system?
During this time a supernova has exploded in Oakland called the Golden State Warriors. A team built on incredible shooting and fast ball movement that is the epitome of “blow the doors off” offense. They use this simple math equation 3 > 2. They run their offense to suit their talent and their talent includes 3 of the best shooters in the sport’s history. They know if they can shoot 35% on 3 point shots, it’s is the equivalent of a team shooting 55% on 2 pointers. Since a good shooting team will shoot maybe 48% on those lower-valued shots, they can afford to shoot 35% and still win 2 Championships and hold the record for most wins in a season.
If you made it this far (big IF for most puck-heads) then you are asking what any of this has to do with your RSP.
Well the simple answer is this. Every year I get asked “how much should I contribute to my RSP?” and there is not a hard and fast rule beyond “as much as you are comfortable contributing” which is really gibberish. I think I may have found a more appropriate answer and one that will maximize your efficiency as a contributor.
I will borrow this fantastic chart I found on the weekend from a pseudonymous blogger; Unassuming Banker, and absolutely love it for the simplicity of it all.
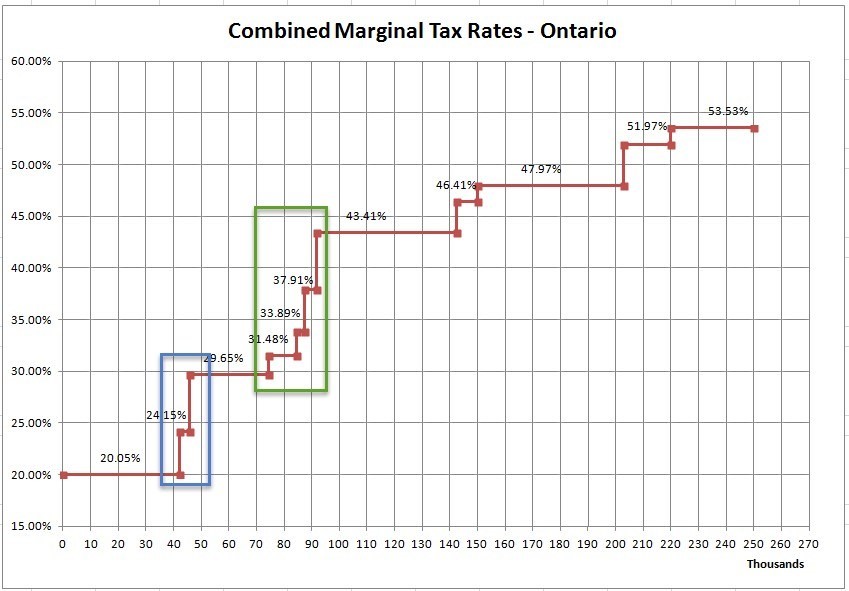
(Source: http://www.unassumingbanker.com/2017/01/19/making-optimal-rrsp-contribution/ )
Simply put, this is a chart of the Tax rates for an Ontario tax payer (Y-axis) and their income in thousands of dollars (X-axis). The beauty of this graph is that you can see exactly where you stand on the chart (FYI- it’s 2017 tax rates) and your approximate marginal tax rate.
Now how can we use this to make your RSP more efficient? Well first it’s important to remember that the RSP is a savings plan where contributions you make can be used to reduce your earned income in a given year. Here is where you get the efficiency you need.
If you earned $90,000 last year, you will be at the 37.9% marginal rate. Simplicity’s sake this means you pay tax of $34,110. Now if you have $10,000 saved and contribute this to your RSP, your effective earnings now becomes $80,000 which means you have dropped to a tax rate of 31.48% and now have taxes owing of $25,184. The after-tax earnings in both cases are very similar ($55,890 vs $54,816) but with the lower figure you now also have $10,000 invested and growing tax-deferred. Which one would you rather have?
There are some great examples in the full blog from Unassuming Banker which I encourage you to read. The simple idea to look to the graph, find your income and then go left to next drop is such great advice. It ensures that you are saving for retirement (long-term goal) while benefitting your tax situation (short-term goal).
As for my Raptors? Well they changed their system to focus more on passing and 3 point shooting. They are still amongst the best teams in the league and are fighting for first place in their conference. Little efficiencies make all the difference and we hope these changes can help them win more in the playoffs.