
Le succès en investissement repose parfois autant sur la gestion des émotions que sur les chiffres. Lorsque les marchés « semblent » catastrophiques, notre instinct nous pousse souvent à vendre ou à rester en retrait. Cependant, l’histoire des marchés a maintes fois démontré que les périodes où l’on ressent le plus de pessimisme offrent souvent d’excellentes opportunités d’achat tactique. Pourquoi ? Parce que les émotions humaines et les biais cognitifs poussent souvent les marchés à des niveaux irrationnels.
Le moment de cette publication de blog n’est pas un hasard – ces dernières semaines, les marchés ont connu une augmentation notable de la volatilité. Cette tendance est principalement alimentée par la rhétorique persistante autour des « guerres commerciales » et des « tarifs douaniers » en provenance de la Maison-Blanche. C’est pourquoi nous souhaitions partager quelques réflexions sur la manière dont nous utilisons le sentiment des investisseurs comme guide pour naviguer dans des périodes comme celle-ci.
Les Données : Ce Que le Sentiment des Investisseurs Nous Apprend
Il existe de nombreux « indicateurs » visant à suivre le sentiment des investisseurs à travers des données. Au fil des années, nous avons appris que ces indicateurs peuvent apporter de la valeur lorsqu’il s’agit de prises de décision tactiques (à court terme). L’idée qui sous-tend la plupart de ces indicateurs est simple et peut être résumée par une citation célèbre de l’investisseur légendaire Warren Buffet : « Soyez craintif quand les autres sont avides, et avide quand les autres sont craintifs. » Poursuivez votre lecture pour découvrir un aperçu de certains de nos indicateurs préférés sur le sentiment des investisseurs – ainsi qu’un regard sur les données actuelles pour chacun d’entre eux.
1. L’Enquête sur le Sentiment de l’AAII : L’AAII Sentiment Survey est une enquête hebdomadaire largement suivie, menée par l’American Association of Individual Investors (AAII). Elle mesure le sentiment des investisseurs individuels en les interrogeant sur la direction qu’ils anticipent pour le marché boursier au cours des six prochains mois.
Composantes de l’enquête
Les membres de l’AAII sont invités à se positionner parmi les catégories suivantes :
1. Haussier – S’attendent à une hausse des prix des actions.
2. Baissier – S’attendent à une baisse des prix des actions.
3. Neutre – S’attendent à peu ou pas de changement.
Les résultats de l’enquête sont exprimés en pourcentage de répondants dans chaque catégorie et sont publiés chaque jeudi.
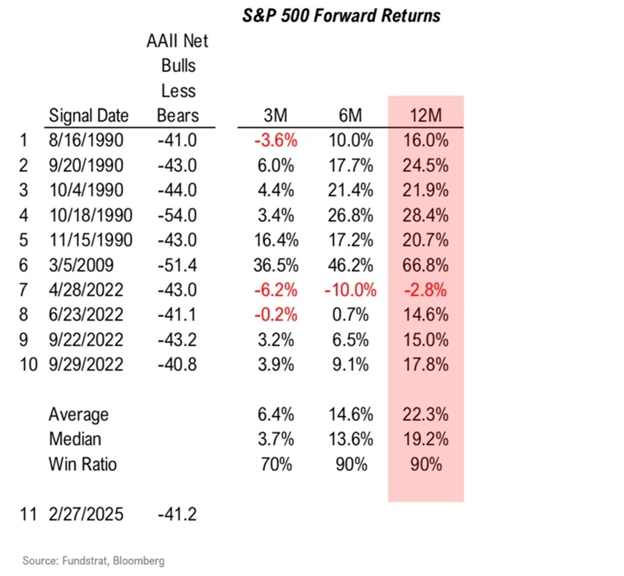
Les résultats les plus récents de cette enquête (au 26 février 2025) montrent une « Net Bearishness » (c’est-à-dire le pourcentage d’investisseurs haussiers moins le pourcentage d’investisseurs baissiers) atteignant -41,2 %, un niveau observé seulement à quelques reprises dans le passé.
Le tableau ci-dessous présente les 10 autres résultats les plus baissiers de l’enquête, la date à laquelle ils ont eu lieu, ainsi que les rendements du marché S&P 500 sur 3 mois, 6 mois et 12 mois qui ont suivi. Dans tous les cas sauf un, les marchés étaient en hausse sur 6 et 12 mois, avec des rendements moyens extrêmement élevés.
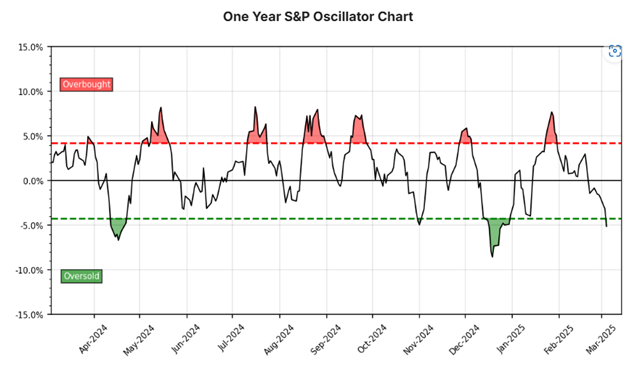
2. L’Oscillateur S&P : L’oscillateur S&P est une mesure à court terme du sentiment calculée selon une formule propriétaire. De manière générale, lorsque l’oscillateur atteint une valeur supérieure à +4, le marché est considéré comme « suracheté », et lorsqu’il descend en dessous de -4, il est « survendu ».
L’idée derrière cet indicateur est de prendre la position inverse – c’est-à-dire de réduire le risque dans les périodes de surachat et d’augmenter l’exposition dans les périodes de survente.
Au moment de la rédaction de cet article, la lecture la plus récente (4 mars 2025) a atteint un niveau de -5,12, indiquant une situation de survente pour la première fois en 2025.
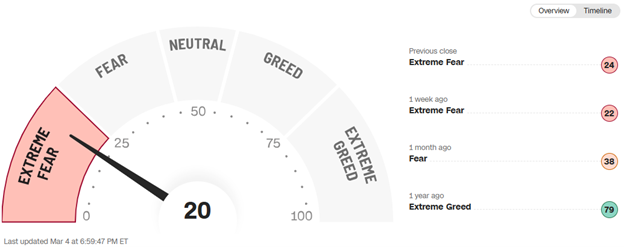
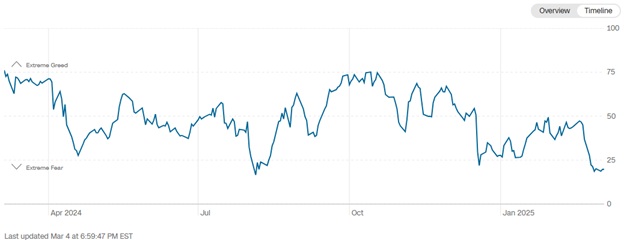
3. L’Indice CNN de la Peur et de l’Avidité : Cet indice suit sept indicateurs (momentum du marché, solidité et étendue des prix des actions, options de vente et d’achat, demande d’obligations à haut rendement, volatilité du marché et demande de valeurs refuges) pour générer une lecture globale du sentiment des investisseurs. Comme les autres mesures, cet indice permet d’adopter une position contraire lorsque les lectures atteignent des niveaux « peur extrême » ou « avidité extrême », qui coïncident souvent avec des points d’inflexion du marché.
En se basant sur les données du 4 mars 2025, l’indice a officiellement plongé dans la zone « Peur Extrême », atteignant ses niveaux les plus bas depuis août 2024. Certains se souviendront que 2024 fut une année exceptionnelle pour les marchés, et qu’août 2024 a représenté la meilleure opportunité d’achat intra-annuelle (alors que les marchés faisaient face à des craintes de récession).
Les Biais : Pourquoi Oublions-Nous l’Évidence ?
Interrogez n’importe quel investisseur en période de marché calme, et il vous répétera le mantra « acheter bas et vendre haut ». Pourtant, au moment d’exécuter cette stratégie, les émotions prennent souvent le dessus. Pourquoi ?
- Aversion à la perte : La douleur de perdre est considérée comme deux fois plus forte que le plaisir de gagner, nous rendant hésitants à acheter au bon moment.
- Biais de récence : Nous supposons que la récente baisse va continuer indéfiniment, en ignorant les leçons de l’histoire.
- Effet de troupeau : Nous nous sentons plus en sécurité en suivant la majorité, même si cela signifie vendre au pire moment.
Atténuer ces biais permet aux investisseurs de mieux profiter des performances positives du marché par la suite. Rester investi sur l’ensemble d’une année civile augmente considérablement les chances d’obtenir de meilleurs rendements.
Depuis 2015, le S&P 500 a affiché un rendement annuel moyen de +12 %. Cependant, si l’on exclut les 10 meilleurs jours de chaque année, le rendement annuel moyen tombe à -10 %.

L’Opportunité : Quand la Douleur Conduit aux Gains
Historiquement, la peur extrême ne dure pas. Lorsque le sentiment atteint les niveaux de négativité que nous observons actuellement, les probabilités favorisent des rendements solides sur les 6 à 12 mois suivants, comme illustré par les données précédentes.
Dernière Réflexion : Aller à Contre-Courant
Lorsque nous parlons à nos clients et partenaires en période de marchés haussiers, nous utilisons souvent des graphiques historiques pour illustrer nos points de vue. Inévitablement, ces graphiques sont examinés, et les différentes corrections de marché sont identifiées comme « d’excellentes opportunités d’achat » (fin 2018, début 2020 et la majeure partie de 2022 étant les exemples récents). Pourtant, lorsque la volatilité augmente, non seulement nous ne voyons pas les investisseurs en profiter, mais nous recevons aussi des questions sur l’opportunité de vendre.
L’investissement ne consiste pas à se sentir à l’aise sur le moment, mais à prendre des décisions éclairées, basées sur les faits et les précédents historiques, qui nous récompenseront sur le long terme. La prochaine fois que la peur prendra le dessus, rappelez-vous : l’histoire récompense ceux qui vont à contre-courant.
Sincèrement,
Di Iorio Wealth Management