
As most of our clients know, we have long been believers in the Generational Cycles theory. This theory suggests that the S&P 500 follows an alternating trend of Secular Bull Markets and Secular Bear Markets, lasting 16-18 years each, which are broadly driven by technological advances and their associated influences on inflationary trends and productivity gains.
The chart below is one we have come back to time and time again to illustrate these, and it broadly indicates that we are currently in the middle stages of the third secular uptrend in the last 100 years, which looks to peak around 2034. If this proves to be the case, it should remain highly rewarding to be broadly exposed to equities for the next 10 years.
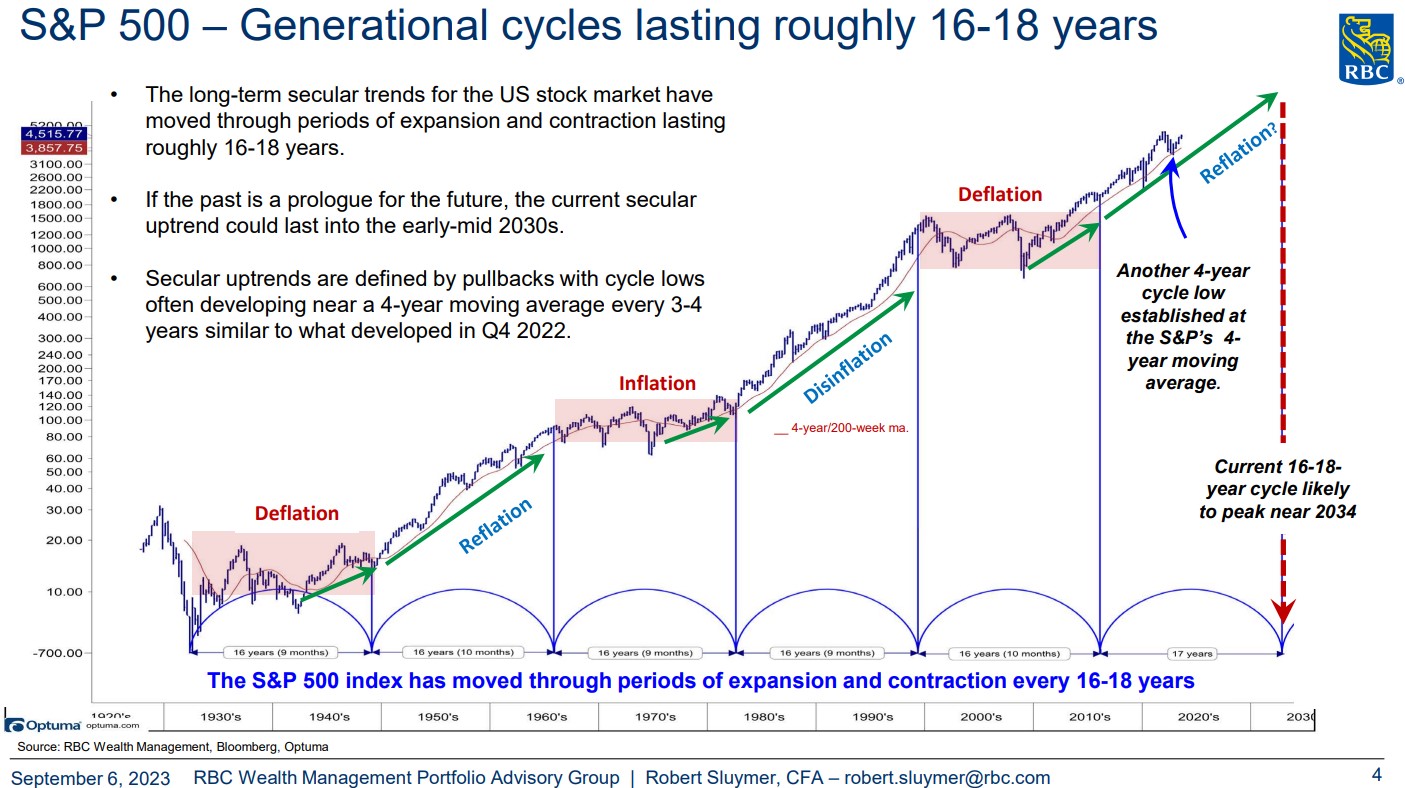
However, markets were anything but rewarding to investors in 2022 – and the overall levels of uncertainty we are faced with today (rising rates, high inflation, recession fears, etc.) hardly make this feel like the middle-innings of a secular bull market.
It was hearing this exact sentiment from clients that led us to start referencing another phenomena in our discussions during recent months. This time we are focusing on a repetitive 4-year cycle that can be observed in the very same S&P 500 index that our long-term chart above focuses on.
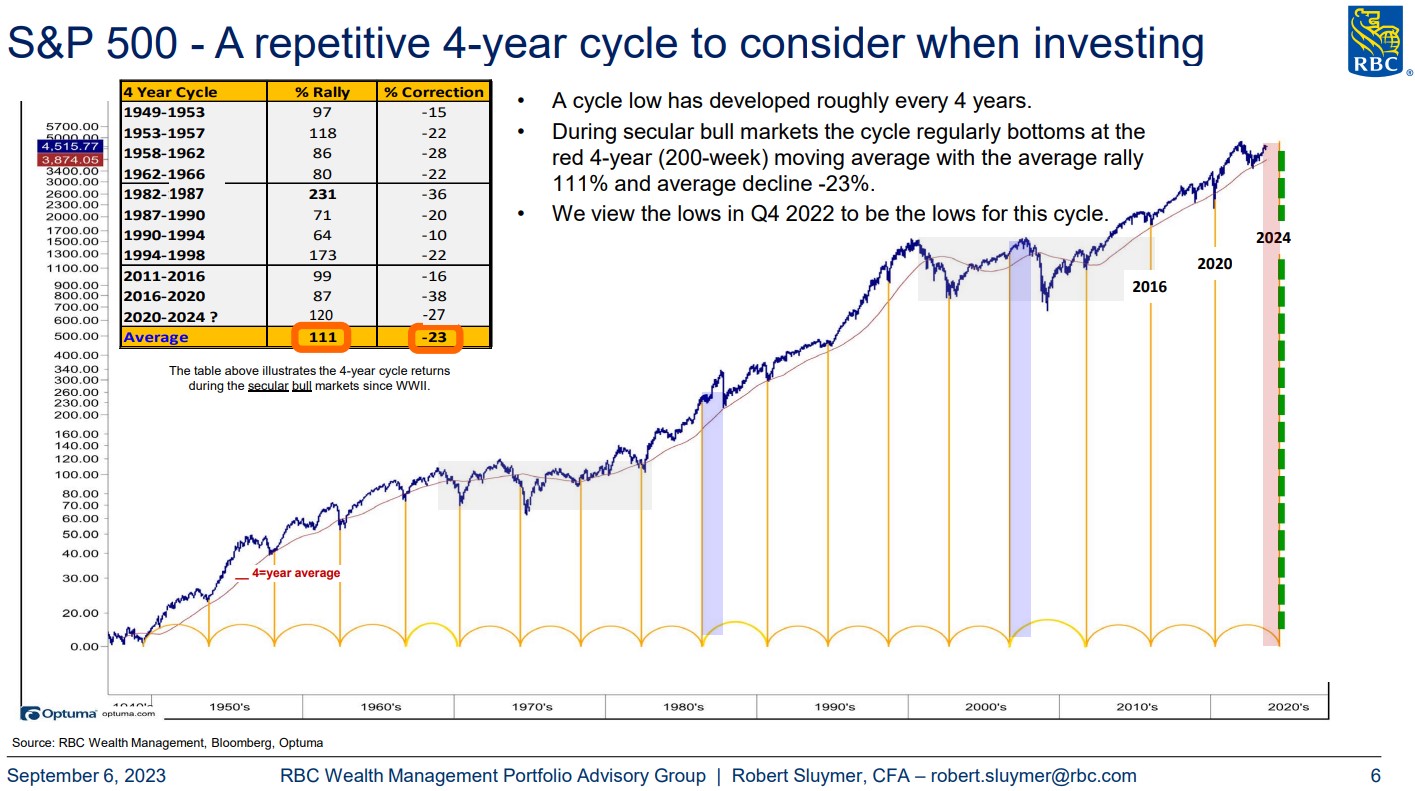
What this chart shows is simple – it is the S&P 500 divided into 4-year increments, indicated by the vertical yellow lines. What is interesting is that these 4-year increments coincide closely with periods of market drawdowns and subsequent rallies. The main point we have been focusing on with clients is that even within secular bull markets there are periods of significant corrections, and these have historically been some of the best entry points investors could hope for.
The table towards the top-left of the chart represents exactly this. It lists the previous two secular bull markets, as well as the one we believe we are currently in today, and breaks these down into 4-5 year sub-sections. Each of these sub-sections see significant upside (indicated by the “% Rally” column), but they also have seen periods of significant drawdowns along the way (indicated by the “% Correction” column). In fact, on average, these 4-5 year periods see rallies averaging around 111% with corrections along the way averaging 23%. The current 4-year cycle is expected to reset in 2024, and the 27% maximum drawdown we saw in 2022 appears to have been the “corrective moment” of this cycle.
The bottom-line of these charts are simple:
- Being invested in the market during the up-trending “Generational Cycles” is extremely rewarding over time
- When markets correct within the shorter “4-Year Cycles” (ex. 2022), it is not the time to be fearful – but rather the time to be opportunistic and look forward to strong returns over the following years
As we so often remind clients, returns do not come linearly. They most often come in fits and starts – and the times that feel the worst often immediately precede the periods of the strongest performance. We believe that the next several years will prove extremely rewarding to investors who seize the opportunities presented, and we are focused on doing exactly that.
If you have any questions, do not hesitate to contact us.
Sincerely,
Di Iorio Wealth Management