“What you do in private always shows in public. Reading shows in conversations. Your workouts show in your physique. Your diet shows in your energy. Your discipline shows in your confidence. Your focus shows in your results. You are what you cultivate when no one is watching.”– Unknown
“Over the years, I have observed that those who are blessed with the most talent don’t necessarily outperform everyone else. It’s the people with follow-through who excel. This is true in all walks of life—in business, sports, and the arts. I see it constantly in the sales field. And you can see it happen with young people in school. The top students in a class aren’t necessarily those with the highest IQs; they’re the ones with the best study habits. They consistently follow through every day with their assignments. The real achievers in this world are those who follow through in all things, big and small." – Mary Kay Ash, American businesswoman and founder of Mary Kay Cosmetics, Inc.
Note that the contents of this memo are all my thoughts, and not the views of RBC Dominion Securities. As well, no part of this content was AI-assisted or created.
[YOU CAN LISTEN TO THE ABBREIVATED PODCAST VERSION OF THIS NOTE HERE]
Friends & Partners,
As we kick of the new year of 2026, this month’s quotes are interesting as many of us seek to uphold our new year’s resolutions – we all want to do better, in all aspects of our lives. The one thing I try to impart on our children is work ethic and discipline, so I love this quote. Throughout my life, I was never able to quite figure out how the symbolic ‘fatcat’ senior executives had the discipline to advance. But I digress.
It's that time of year that you’ll find a zillion ‘outlooks’ for 2026, and most will prove to be wrong. But that doesn’t mean we shouldn’t try to frame both the opportunities and the risks, as it is the risks that sneak up on you. The one tenet of investing will always hold true – patience and compounding. “Stocks (and markets) rarely perform in the time frames we predict, and it’s why the market only works for investors that have more patience than they thought they would ever need.” – Ian Cassel.
I will start with the bottom line: the positive case for the markets may have been somewhat diminished as of late, but the general overall supports are still in in place. After 3 years of strong gains for most equity markets, nothing historically rules out a 4th by any means. The combination of lower inflation, lower interest rates, and faster GDP growth required for continued gains won’t be easy to achieve, but the pieces are in place at this point. Above average gains may be difficult, but positive returns should be achievable.
We can’t seem to go a day without highlighting the AI trade, and “AI enthusiasm” isn’t dead by any means, but it has sustained damage and sooner than later the market needs the data that shows all this massive spend is producing positive returns on the investment (ROI). It’s reasonable to assume that tech and tech-aligned sectors will not carry the market higher into 2026 as they did in ’24 and ’25 – this bullish tailwind has been reduced at a minimum.
Central banks have been supporting markets for some time, but that is coming to an end if you expect interest rates to drop significantly from here (and there are whispers of interest rate increases next year!). According to the US Federal Reserve, they are effectively “done” with rate cuts, which removes a bullish tailwind that has excited the markets since mid-2024. Yes, the new Fed chair could be more dovish than Powell, but the chair is just one vote and as we’ve seen, the Fed is very divided. Positively, the Fed isn’t a headwind on growth and the Fed being on pause isn’t a problem as long as economic data stays solid. However, if they do continue to cut rates a bit from here, and inflation rears up again, bonds could have a scary moment. Also, if Trump gets his way and puts in a Fed Chair that is way too ‘soft’, the markets may not take kindly to that development.
When it comes to the economy, it has held up, and the outlook is still OK for now. There is a growing disconnect between recently weak ‘soft’ data (like consumer sentiment) and still-resilient ‘hard’ data (jobs numbers, GDP and capital goods figures) which is clouding the outlooks for growth, inflation and Fed policy expectations. I will expand on this in a section below.
So, is the outlook for 2026 suddenly bad? No. The diminishing of tailwinds doesn’t mean the outlook is suddenly negative. But I do think that, as we start 2026, the case for the “rest of the market” (outside of AI) finally taking leadership from tech is the strongest it’s been in over 2 years.
You’ve been spoiled for well over a decade now, and things are likely to shift. Remembers, we’ve had a:
- Post-crisis bull market (both the 2008 financial crisis and COVID crisis)
- Zero interest rates (ZIRP) for 15 years (the Fed holding rates at 0%)
- Quantitative Easing (QE) for years (the Fed adding $4 trillion to its balance sheet and consequently to the financial system’s reserves, and another $5 trillion after COVID)
- Financial repression (where ‘real’ rates (net of inflation) was negative for most of the last 17 years – highly incentivizing people to move up the risk curve to achieve a positive real return on their capital and pushing up the valuation of everything, including real estate and stocks)
- Earnings recovery, where earnings across the S&P 500 were $50/share in 2008 and are $270/share today. Multiples expanding along with this, generating huge returns in markets
- 16 years without a recession (the COVID anomaly notwithstanding)
Things will be different from here, we’re not in Kansas anymore. But things could remain good for investors who can navigate and add value. Value and returns will likely come from different places than they have, and blindly following the index may not result in performance – the chart below shows the relationship between starting valuations and subsequent 10-year market returns. With the S&P 500 trading near a 23x forward price/earnings multiple, the historical implication is that they may be very little in the way of real, inflation-adjusted returns over the next decade without doing things differently. Markets that begin from elevated valuations don’t compound smoothly, and eventually work their way back toward reality.
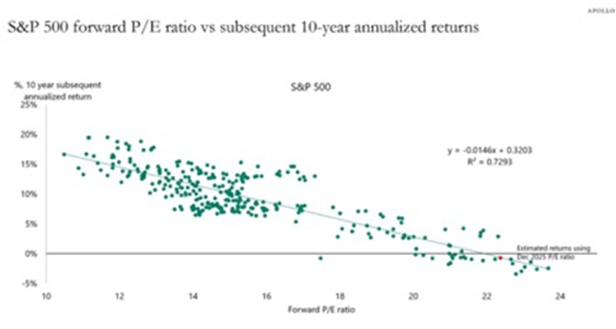
Source: Apollo
We may want to consider how to build out our portfolios to remain resilient in a tumultuous, changing and uncertain environment moving forward, because traditional portfolios may not cut it. Remember that traditional ‘60/40’ portfolios (meaning 60% stocks and 40% bonds) have endured six ‘lost decades’ since 1900 as well. There have been 6 periods in which the 60/40 portfolio would have either broken even or lost money relative to inflation. Making matters worse, these periods lasted an average of 11 years. Unsurprisingly, the six periods in which investors received either no or negative real returns all share the common characteristic that they all followed exceptionally strong periods of return, which in turn left them with starting points with either stocks and bonds or both trading at extremely high valuations. Sounds familiar…

Other Interesting Things To Highlight
I was excited to support the Georgian Triangle Humane Society again, pledging $10k match against donations made on Giving Tuesday, a global day of generosity - and a powerful moment to change the lives of pets and people in our community. Because of you, Giving Tuesday became a day of real and meaningful impact for pets who needed us most. Amazingly, we raised over $112,000 in just 24 hours. This incredible support means more pets will receive urgent medical care, safety, comfort, and the chance to begin a new chapter. Thank you for believing in this work. Thank you for believing in every pet who comes through their doors. Thank you for helping shape their stories.

A Risky Outlook From Here?*
The economy continues to hold up fairly well, but there’s a growing dichotomy between the ‘soft’ and ‘hard’ data, which we need to continue to monitor. Here’s what I mean.
What Is the ‘Hard’ Data Saying?
Looking at the hard data, between historically low initial jobless claims, resilient consumer spending metrics within the latest Retail Sales release, strong Core Capital Goods and Durable Goods data, and the much-better-than-expected Q3 GDP report complete with strong details, investors would be led to believe the economy is in good shape as we roll into 2026. A lot of those supportive economic reports are notably dated, but still provide measurable evidence that there is no reason to fear an economic downturn is looming.
But What Is the Soft Data Saying?
These are more timely reports available currently with the December releases of the Consumer Sentiment and Consumer Confidence indices, along with the November NFIB Small Business Optimism Index. The general theme across all three of those timely survey-based economic data sets is in stark contrast to the more upbeat hard data, as the Uncertainty Index within the NFIB Small Business report is holding up near multi-decade highs and well above its long-term average. The headline Consumer Sentiment Index is sitting near all-time lows, and the Expectations Index within the latest Consumer Confidence Index has remained below 80 for 11 consecutive months, which the Conference Board notes is a “threshold below which the gauge signals recession ahead.”
The jobs outlook is ‘OK’ but deteriorating. Between the government shutdown and changes made by the new Trump administration, official jobs data has been hard to interpret lately. One thing that’s clear, though: job growth is getting narrower. The chart below highlights how the healthcare and private education segments now account for practically all new job creation. But this isn’t because those sectors are expanding.

Investors are still pricing in a soft economic landing with conviction. If the hard data holds up, then things will remain ‘fine’ in markets amid optimism surrounding the potential for strong earnings growth in the 2026 quarters to come. Conversely, the persistent weakness in survey-based data highlights downside economic risks, and if weakness in consumer sentiment and business confidence spills over to impact “real activity,” we will see a downturn. Right now, the latter scenario is not priced into the markets and that should be viewed as a significant risk for investors.
Finally, consumers have a wide range of disparity among them between the ‘haves’ and the ‘have nots’.
You’ve maybe heard the term that we’re in a ‘K-shaped economy’, meaning that the wealthier contingent is doing well, while the rest are struggling. This is true, and skews the data we see. Stock markets have done well, helping out the wealthier among us. Conversely, lower-income Americans continue struggling with elevated living costs. While inflation has slowed, prices remain well above pre-pandemic levels, hitting households that spend most of their income on necessities. Recent policy changes including tariffs and spending cuts, disproportionately burden these families. The job market presents additional challenges, with wage growth for lower-income workers now lagging behind higher earners, reversing the previous decade's trend. At 3.6% annually, wage growth barely exceeds the 3% inflation rate, leaving little room for real income gains.

Sources: Yale Budget Lab, Congressional Budget Office, RBC GAM.
The K-shaped economy has transformed consumption patterns, with the top 10% of earners now accounting for nearly half of all consumer spending — a record high. This concentration makes economic growth increasingly dependent on wealthy households' spending decisions and continued stock market gains.
However, a K-shaped economy doesn't necessarily predict an imminent recession or market crash. The current structure can persist as long as the upper segment remains strong. It also doesn't mean lower-income conditions can't improve — factors like further interest rate cuts or cooling inflation could provide relief.
This all circles back to issues within Central Banks – since 2008, the Fed’s attempts to stimulate the economy have served mainly to stimulate asset prices, mainly stocks and real estate. Then, instead of recognizing this and finding new methods, they keep doubling down on the same failed policies. And we keep getting the same results: a wide and widening gap between those with assets and those without.
The Tech/AI-Lead Market Could Shift – Signs Of A Bubble?*
There is no shortage of enthusiasm around AI and the changes it will bring for society – I have written extensively about the opportunities and risks of that in recent memos HERE and HERE. The sector caught some headwinds in December as investors finally have concerns about the pace of capex spending on data centres along with the ROI of these massive investments. The bellwether for these concerns is Oracle (ORCL), which is spending so much on AI infrastructure that it now has negative cash flow. ORCL is important because it personifies the shift in sentiment on AI infra-structure spending. Prior to September, the more a tech company spent on AI, the more the stock would rally. Now, this extreme spending is being met with some scepticism and investors want to see AI investment combined with some restraint.
Blue Owl (a huge alternative lender, with total assets managed ~$260 billion) walked away from funding a large data centre being built by Oracle for OpenAI. Blue Owl is not a marginal player, they have been one of Oracle’s most significant financial partners, repeatedly stepping in with equity and debt to help fund large-scale data centre projects. When a firm that specializes in financing hyperscale infrastructure decides that a flagship AI project no longer makes sense on its terms, it suggests that the economics of these deals may be becoming harder to justify. At a minimum, it suggests that the margin for error is shrinking.
Barclays has since articulated a similar concern more formally, warning that free cash flow may no longer be sufficient to support the scale of AI capital expenditure now being contemplated. Data centres can cost $50–60bn per gigawatt, pushing projected global spending into the trillions of dollars. What once looked like a self-financed arms race increasingly resembles one funded by debt, leases, and creative structures designed to keep the story intact.
This all suggests the cost of building these data centres is going to continue to rise and that some of those currently planned will not get built.
Here’s the rub – without AI buildout, US GDP growth will be significantly lower. Some have said most of the recent positive GDP is from AI.
As to the extent of the overvaluation of these names, GMO writes that “one striking sign of investor euphoria is that more than 30% of U.S. market capitalization now trades above 10x sales, a level reminiscent of the tech bubble. History suggests such extremes rarely persist without painful corrections.”

Carlyle quantifies this risk in noting that “if we assume that the PP&E (property, plant, and equipment) on balance sheet should be valued at cost and assign a 10x P/B multiple to the rest, the hyperscalers’ market caps would be roughly half of what they are today.”

Another good data point from Kevin Muir is this: Back at the beginning of 2024, analysts forecasted that NVDA’s 2030 revenue would be $150 billion. Today, they believe that in five years’ time, NVDA’s revenue will be higher than $0.5 trillion. To put it into context, here are their revenue numbers for the past five years:
- 2020: $10.9 billion
- 2021: $16.7 billion
- 2022: $26.9 billion
- 2023: $27.0 billion
- 2024: $60.9 billion
- 2025: $130.5 billion
Can this growth rate continue to hit $500 billion, and more importantly, can they maintain big margins during this?
Let’s hope the market doesn’t start to get really scared of a negative scenario here:


Because, so far, the market remains pretty excited overall, with fund managers most optimistic since middle of 2021:

And this is highlighted by the amount of fund manager cash holdings currently being VERY low, meaning not much dry powder left for them to deploy:

But can we be in a bubble when everyone is talking about it? “You’re kidding yourself if you think a stock-market bubble can’t form when there is widespread concern about a bubble. Take the housing bubble: Google search interest reached a peak in 2006, coincident with the highest precrisis level for home prices,” writes MarketWatch.

Give Me Hope! There Are Lots Of Reasons For Optimism Too*
I don’t mean to sound like Debbie Downer, because after all, I’m actually supportive of the overall outlook here! I just like to highlight all the risks, we have to consider both risks and opportunities and weigh them accordingly.
One of the big points of pushback is investors hating to invest at all time highs, and want to ‘wait for a pullback’. Generally a bad idea. We hit a new high every few weeks on average! JP Morgan also notes that investing at an all-time high is no riskier than buying at other times:

Source: JP Morgan
There are lots of reasons to think we’re far from a bubble as well. Alpine Macro notes that the forward P/E for the S&P 500 has remained virtually unchanged, hovering around 21 to 21.5 X for nearly 2 years. In 2025, the entire stock market boom has been driven by booming corporate profits, with the P/E ratio going nowhere. For any equity market to qualify as a bubble, you need massive multiple expansion to levels that cannot be justified by any reasonable earnings assumption. That is not the case today in their view.

There’s a ton of cash in money market funds as well, ready to backstop pullbacks and fuel markets. Since 2020, money market funds and demand deposits have surged by roughly $10 trillion. As it stands, the combined total now amounts to $14 trillion, or about 20% of U.S. stock-market capitalization. This vast pool of liquid savings has been locked up by high real short-term rates. But as the Fed continues to cut rates, savers will be increasingly compelled to redeploy this liquidity into risk assets. So don't be overly bearish on risk when rates are falling.

Globally, financial conditions have softened, with broad indicators of monetary tightness moving toward their least restrictive levels in several years – a backdrop that has historically been supportive of equity markets, even if the effects are not always immediate or uniform.

Liquidity conditions also remain broadly supportive. Market expectations around the next Federal Reserve chair to be a bit of a ‘dove’ are high. Measures of excess liquidity, such as real M1 growth relative to G10 economic activity have not yet begun to contract and remain consistent with an environment that could support strong markets. That said, liquidity effects can shift quickly, and their influence on equities is often uneven, underscoring the need to treat these signals as helpful context rather than firm predictors.

Global economic momentum appears to be stabilizing and may be turning upward. Global leading indicators – including the OECD’s composite index, which is designed to signal turning points in the business cycle and track activity relative to long-term potential – has been trending higher. This improvement suggests the global economy may be nearing the early stages of a cyclical upswing. While these indicators are not guarantees and can be subject to revision, they currently point to a backdrop in which global activity is firming rather than weakening, a development that has historically been constructive for risk assets.

Broader credit conditions remain relatively stable. Despite some recent headlines, most segments of the credit market continue to look benign. One of the most reliable gauges of credit health – corporate bankruptcy filings – has been trending lower, suggesting that stress in the system remains contained for now. While conditions can change as growth and policy evolve, the current backdrop does not point to escalating credit risk in the near term.

Finally, near-term U.S. recession risk remains low. While equity markets tend to struggle most during recessions, the probability of a U.S. downturn over the next 3-6 months remains low. The labour market is cooling gradually rather than abruptly, and inflation may experience a temporary soft patch as declines in home and rental prices flow through to shelter components of the CPI (inflation). Taken together, these trends point to an economy that is slowing in a controlled manner rather than contracting.
