
The specter of doggedly persistent inflation and skepticism about central banks’ abilities to effectively cope with it—without pushing major economies into recession—have pressured the global equity market lately.
The S&P 500 is on track for the sixth straight week of losses and other major markets have sold off as well. While roughly one-third of the U.S. market’s outsized gains since the March 2020 COVID-19 low have eroded away, the chart illustrates that the S&P 500 is still up 22 percent since before the pandemic began and has widely outpaced the MSCI EAFE Index, which mostly includes European stocks.
Performance of select equity indexes since January 2020, just before COVID-19 hit
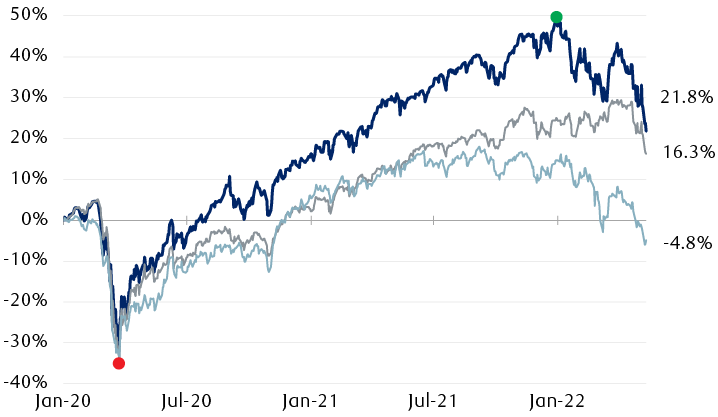
The line chart shows three equity indexes since January 2020: The S&P 500, Canada's S&P/TSX, and MSCI EAFE (Europe, Australasia, Israel, and the Far East). All three indexes plunged in unison by more than 30% and bottomed on March 23, 2020 when the COVID-19 crisis was at its most uncertain point. After that, all three indexes steadily climbed, although the S&P 500 outpaced the other two. While the MSCI EAFE peaked first in the summer of 2021, the S&P 500 didn't peak until January 3, 2022, and the S&P/TSX peaked in late March 2022. All three indexes have turned sharply lower recently. The performance since January 2020 is as follows: S&P 500 is up 21.8%, the S&P/TSX is up 16.3%, and the MSCI EAFE is down 4.8%.
Source - RBC Wealth Management, Bloomberg; data range 1/1/20–5/11/22
Despite the current challenges, we believe the U.S. market has the potential to deliver worthwhile gains over the next 12 months:
- Our economists anticipate domestic inflation pressures will recede somewhat in the second half of the year, and historically, the market has rallied within 12 months after a peak in inflation;
- Recession risks are still no worse than moderate according to a range of our indicators;
- We think the Fed has some room to raise interest rates without breaking the economic expansion, and will assess the impact of its rate hikes along the way;
- Earnings trends are still generally good at a time when the S&P 500’s price-to-earnings valuation has become cheaper at 17.3x the 2022 consensus forecast; and
- Investor sentiment is quite bearish, and this is typically a contrary indicator for the market.
As long as conditions point more toward a U.S. economic “growth scare” instead of a full-blown recession, and geopolitical risks don’t worsen, we think any further downside for North American equity markets should be limited.
It’s important for investors to recognize this is indeed a unique period with peculiar challenges that are well outside the scope of a normal business cycle. Supply chains have not fully recovered from the previous COVID-19 disruptions, and new supply chain pressures have accumulated due to China’s renewed lockdowns and the crisis in Ukraine along with the related sanctions on Russia. These factors make it more challenging for central banks to tame inflation, particularly since the Fed began hiking rates late into the inflation surge.
We think equity markets are having difficulty gauging the lingering impact of these unique pressures on economic and corporate earnings growth and how long they will last—thus the volatility and lengthy selloff. At this stage, it’s worth considering historical performance trends surrounding previous high-inflation episodes, and during “growth scare” and recession scenarios.
Inflation’s shadow
On Wednesday, when the Bureau of Labor Statistics reported that U.S. consumer inflation retreated slightly to 8.3 percent year-over-year in April from 8.5 percent in March, it didn’t provide much comfort for market participants, nor did the pullback in the core rate (excludes food and energy) to 6.2 percent from 6.5 percent. The consensus forecast of economists was looking for these measures to ease more.
Peaks in the U.S. inflation rate of 6% or more since 1950
Consumer Price Index (year-over-year % change)
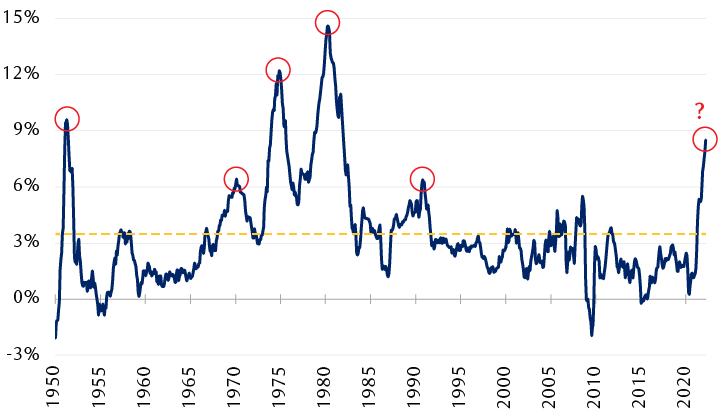
The line chart shows the U.S. Consumer Price Index (inflation rate) since 1950. It highlights four previous peak levels that were above 6%: 9.4% in 1951, 6.2% in 1970, 12.3% in 1974, 14.8% in 1980, and 6.3% in 1990. The chart also shows he most recent peak in inflation of 8.5% in March 2022.
Source - RBC Wealth Management, FactSet; monthly data through April 2022
While services prices (includes utilities, airfares, hotels, and rents) accelerated as we expected in April, goods prices unexpectedly ticked higher as well. Furthermore, a pullback from March’s runaway energy prices was offset by surging food prices in a number of categories.
It’s not yet clear if the peak rate of inflation has already occurred for this cycle, but our economists don’t see much scope for inflation to jump much higher over the near term. There are reasons to believe it will ease by the end of the year, albeit to a still “uncomfortably high” level, according to RBC Global Asset Management.
Another silver lining is that when the peak rate of inflation has occurred in previous periods, the stock market has historically mounted meaningful rallies in subsequent months—even during periods when overall economic conditions were subpar and uneven. Since 1950, following the five previous times that inflation peaked at a rate of six percent or higher, the S&P 500 had climbed an average of 19.4 percent in the 12 months following, as the inflation rate drifted downward, as the table directly below illustrates.
S&P 500 performance following peaks in inflation
| Date | 3 months | 6 months | 12 months | 24 months |
|---|---|---|---|---|
| 5/31/51 | 8.2% | 6.3% | 10.9% | 14.0% |
| 2/28/70 | -14.5% | -8.9% | 8.1% | 19.1% |
| 12/31/74 | 21.6% | 38.8% | 31.5% | 56.7% |
| 5/31/80 | 10.0% | 26.3% | 20.0% | 0.6% |
| 12/31/90 | 13.6% | 12.4% | 26.3% | 31.9% |
| Average return | 7.8% | 15.0% | 19.4% | 24.5% |
Source - RBC Wealth Management, FactSet; returns are cumulative
Growth scare jitters
In addition to inflation, much will depend on what happens to economic growth. Currently, our economic indicators are signaling that the U.S. economy is in the midst of a “growth scare” rather than staring a recession in the face.
A “growth scare” occurs when economic growth is at risk, and stokes very real fears of either slow and uneven growth or recession, but in the end a recession is avoided and economic growth resumes at a normal pace over time. Growth scare episodes are common each and every economic expansion cycle, and often cause meaningful market pullbacks.
The table directly below shows how the S&P 500 was impacted surrounding four previous growth scares since 2009. The S&P 500 declined 17.3 percent, on average, and the declines ranged from about 14 percent to almost 20 percent. By comparison, the S&P 500 has declined 18 percent so far this period—within the “growth scare” zone. What’s notable is that after the S&P 500 bottomed in each of the four previous periods, the market built on its gains and was higher by almost 30 percent 12 months later, on average.
S&P 500 pullbacks during post-financial crisis “growth scares”
| Event | Decline details | Cumulative return after the bottom | ||||
|---|---|---|---|---|---|---|
| Market peak date | Days to bottom | Decline % | 6 months | 9 months | 12 months | |
| European debt crisis | 4/23/10 | 70 | -16.0% | 23.0% | 30.3% | 31.0% |
| U.S. debt downgrade | 4/29/11 | 157 | -19.4% | 28.6% | 23.2% | 28.7% |
| Industrial recession | 5/21/15 | 266 | -14.2% | 19.5% | 18.5% | 26.6% |
| QT & U.S./China trade dispute* | 9/20/18 | 95 | -19.8% | 18.2% | 20.0% | 32.0% |
| Average | 147 | -17.3% | 22.3% | 23.0% | 29.6% | |
* “QT” stands for the Fed’s quantitative tightening
Source - RBC Capital Markets U.S. Equity Strategy, Haver Analytics
Recession signals are still flashing green
Markets usually experience deeper and longer downturns when recessions unfold. Surrounding 13 U.S. recessions since 1937, the S&P 500 declined 31.8 percent and the market took over a year to bottom, on average. But on all but one occasion, the market bottomed before the recession officially ended.
Our key leading indicators are currently not signaling that a recession is a high risk in the next 12 months. In fact, they are all signaling the expansion will persist; the indicators are currently positioned like they were in April, when we last provided an update of our recession scorecard. And this is despite the -1.4 percent Q1 GDP reading that was largely caused by an aberration in net export data due to lingering supply chain challenges. But we are cognizant the indicators could change and there are unique risks facing the U.S. and global economies, so we can’t rule out that recession risks could increase later this year or next.
Ride through the turbulence
We think the S&P 500’s path in the coming months primarily will depend on inflation trends, the effectiveness of the Fed’s policy decisions, and, importantly, the response of the domestic economy and corporate earnings to both. In our view, the range of potential outcomes—both negative and positive—is still rather wide and it will likely take the market some time to work through the uncertainties. There could be additional market volatility and downside between now and a shift to sustainably higher levels in major indexes. But if a “growth scare” scenario plays out and a recession is avoided, as our economic indicators are currently suggesting, we think the magnitude of market downside and duration of further volatility will be limited.
S&P 500 corrections surrounding recessions
| Recession dates | Decline details | Recession-related details | ||||
|---|---|---|---|---|---|---|
| Market peak date | Days to bottom | Decline % | Recession length (months) | Did the market bottom before the recession ended? | No. of months from market bottom to end of recession | |
| May 1937 – June 1938 | 3/10/37 | 386 | -54% | 14 | Yes | 3.0 |
| Nov. 1948 – Oct. 1949 | 6/15/48 | 363 | -21% | 12 | Yes | 5.1 |
| July 1953 – May 1954 | 1/5/53 | 252 | -15% | 11 | Yes | 9.1 |
| Aug. 1957 – April 1958 | 7/15/57 | 99 | -21% | 9 | Yes | 5.0 |
| April 1960 – Feb. 1961 | 8/3/59 | 449 | -14% | 11 | Yes | 4.0 |
| Dec. 1969 – Nov. 1970 | 11/29/68 | 543 | -36% | 12 | Yes | 6.1 |
| Nov. 1973 – March 1975 | 1/11/73 | 630 | -48% | 17 | Yes | 6.1 |
| Jan. 1980 – July 1980 | 2/13/80 | 43 | -17% | 7 | Yes | 4.1 |
| July 1981 – Nov. 1982 | 11/28/80 | 622 | -27% | 17 | Yes | 4.1 |
| July 1990 – March 1991 | 7/16/90 | 87 | -20% | 9 | Yes | 6.1 |
| March 2001 – Nov. 2001 | 3/24/00 | 929* | -49% | 9 | No | N/A** |
| Dec. 2007 – June 2009 | 10/9/07 | 517 | -57% | 19 | Yes | 4.1 |
| Feb. 2020 – April 2020 | 2/19/20 | 33 | -34% | 3 | Yes | 1.0 |
| Average | 381 | -31.8% | 11.5 | — | 4.8 | |
The 1945 recession is excluded as there was no clear stock market pullback around it. * Surrounding the recession in March 2001 – Nov. 2001, the pullback statistics are based on a March 2000 peak and Oct. 2002 low; the market hit an initial low in Nov. 2001, which was retested and surpassed in 2002. ** The market didn’t bottom until 10 months after the recession ended; this data is not included in the average calculated for this column.
Source - RBC Capital Markets U.S. Equity Strategy, Haver Analytics, RBC Wealth Management