
The Stage is Set
The last post on my blog page was dated May 22nd.
A lot has happened since then…a lot of important stuff, in my estimation.
The S&P500 chart below was posted in my last blog post.
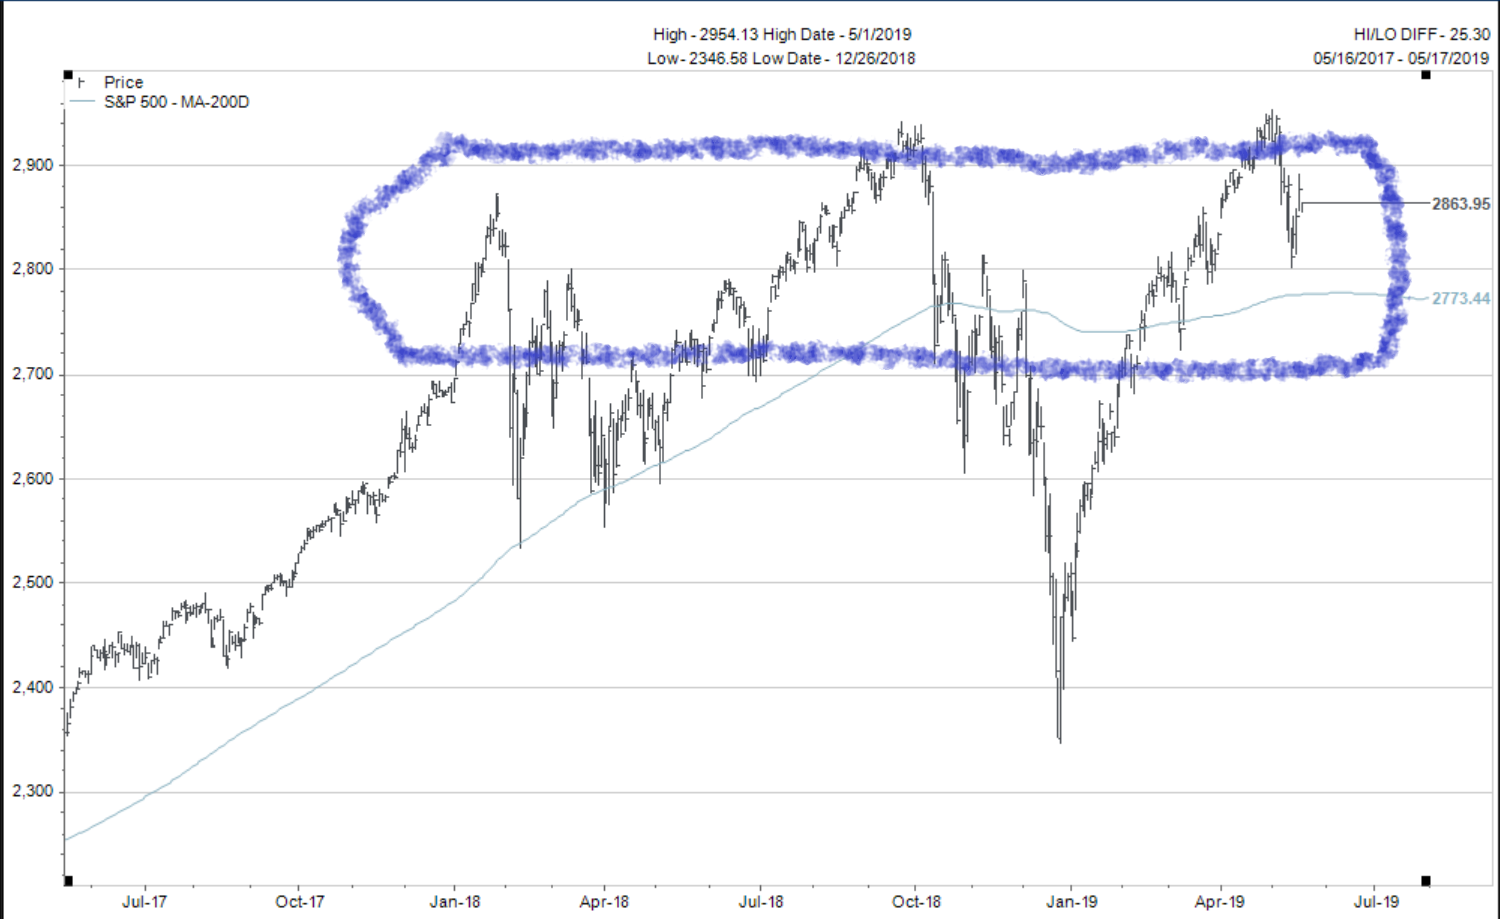
The comment was made that this is a BULLISH chart, and should be treated as such until the (light blue) 200 day moving average line is broken. At that point, a re-assessment of the conditions would be required.
Let’s jump to an updated chart of the S&P500 and focus on what the differences are:
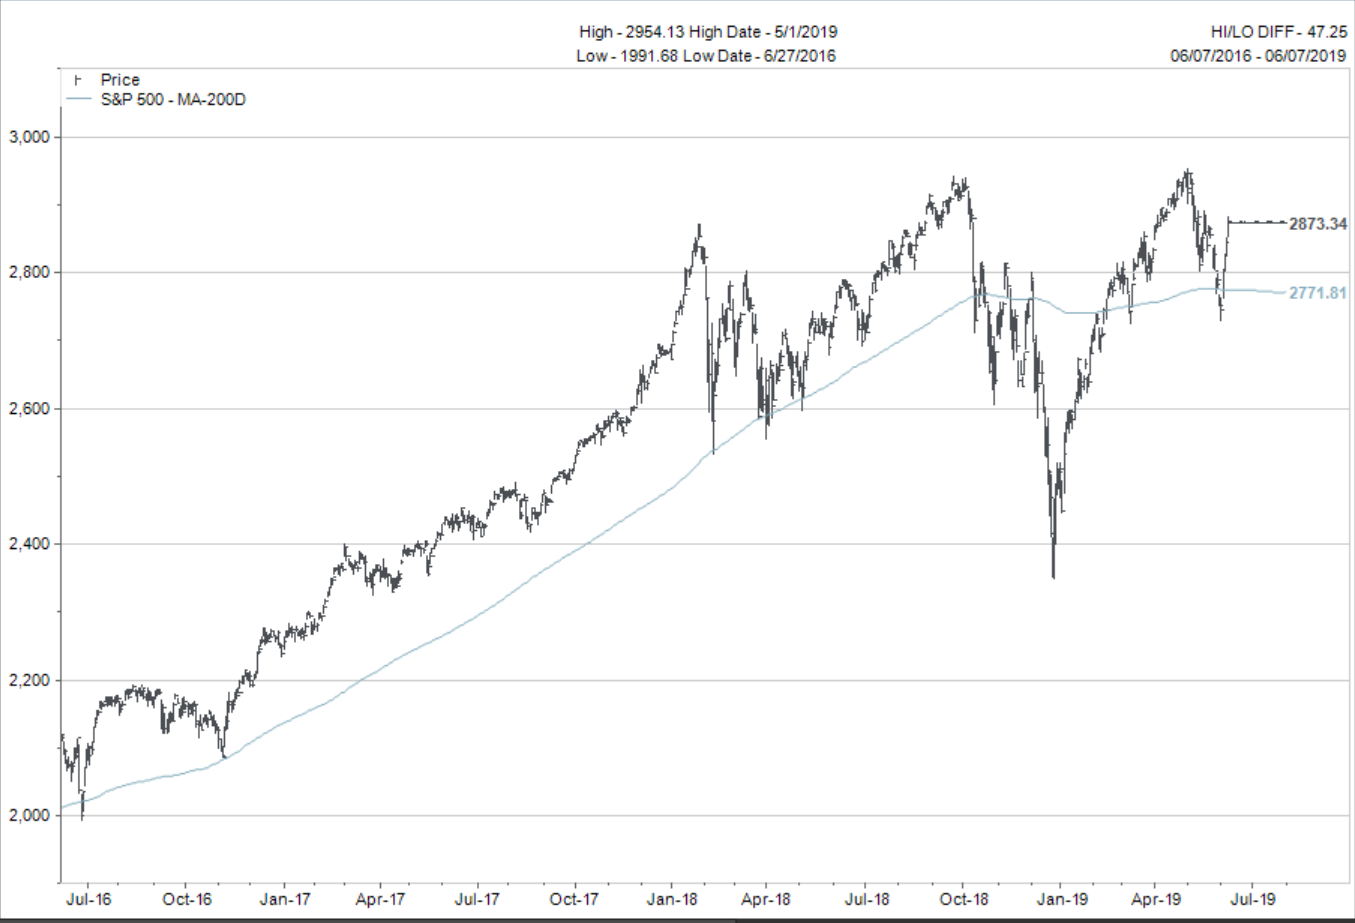
- The June 7th S&P500 close price is only 9 points different that it was on May 16th when the first chart was plotted. (2873 – 2864 = 9 points)
- The S&P500 did trade below its 200 day moving average for about a day and a half.
- The S&P500 is still stuck in its “shaded sideways range” show in the first chart.
If we were just looking at the charts I’d say the stock markets have been behaving mostly normal the past couple weeks.
But the reality is that the second shoe has dropped and now it is game on for both the BULLS and the BEARS.
Let me explain why.
The key is based in how the economy is actually faring relative to the narrative that Wall Street is trying to spin.
Stated simply: The economy continues to grow slowly with a bias to slowing even further but Wall Street wants us to believe the economy is rapidly shrinking because it desires more central bank stimulus.
Let’s zoom in for a closer look at this idea.
The first chart below shows a week old graph of the S&P500 and the combined balance sheets of the US Fed, Bank of Japan and European Central banks priced in Japanese Yen. (h/t Chris Carolan @spirical)
Note the strong correlation to direction.
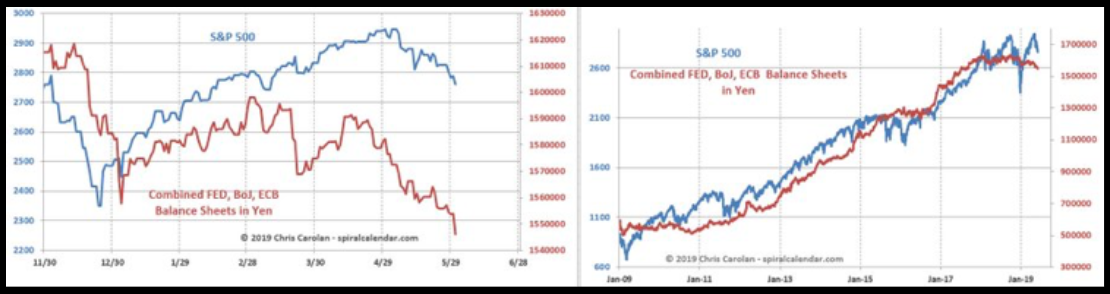
The theme shown…as central bank liquidity dried up, stocks fell.
Now, let’s update the charts to include last week’s market surge.

Sorry for the blurry image, but you can see how quickly the blue S&P500 line shot higher with the red yen denominated, combined central bank debt chart below.
The reason for the shift in central bank debt in yen is twofold:
- The US dollar fell sharply relative to the yen last week.
- The EXPECTATION is now that the US Fed will cut interest rates 3 times for a total of 1% before the end of 2019.
Remember, in November of 2018, the expectation was the US Fed was going to raise interest rates three more times in 2019.
Wow, how expectations have changed in six months!
And this brings me to why the present rally in the global stock markets is such an important rally to watch and trade carefully.
Up until the Fed meeting last week, the US Federal Reserve had only said they would stop RAISING interest rates…not start cutting them again.
Now, Federal Reserve Chairman Jerome Powell, has set the table to meet Wall Street’s expectations for significant interest rate cuts by the end of summer.
If he does not follow through on his words, stock markets will not be forgiving of his misdirection AGAIN.
My personal belief is that the US Fed will only cut rates IF stocks start to fall again so we have entered a “Catch 22” type situation.
Summary Statement: We will treat the 200 day moving average with great respect if stock markets do decline again towards those levels.
Until then, stay BULLISH but be ready to change positions if the rally fails.
The chart below is a good finisher for this section.
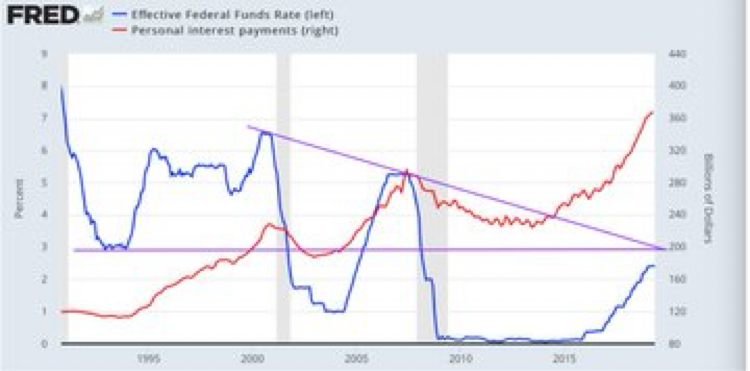
It shows how much less room the Fed has to cut interest rates this cycle compared to the last two recessions.
In 2001, the Effective Fed Funds interest rate started at nearly 7% and dropped all the way to 1%.
In 2007, Effective Fed Funds interest rate all the way up above 5% and they cut to zero percent.
This time they barely made it to 2.5%.
Therefore, interest rate cuts will be significantly less potent in the coming economic slowdown cycle.
This prompts me to believe we could see a Quantitative Easing 4 (QE4) package rolled out much sooner than many believe today.
I don’t want to get ahead of myself, but this is really getting interesting from a financial market and historical perspective.
The low interest rates that have prevailed for so many years now have changed so many things in our world.
- Governments are deep, deep in debt.
- Consumers are ridiculously deep in debt too.
- Average mortgage levels have ballooned higher.
- Companies spent 54% of earnings to buy back shares vs. only 37% of earnings to pay dividends in the past 15 years. Low interest rate fueled support for stocks.
Companies have issued significantly more, lower rated bonds relative to government bonds created (chart below).

The objective is to try and keep things simple in our analysis. Don’t get too caught up in the news of the day and keep our eyes on the variables that matter longer term.
Our goal remains to stay mostly BULLISH but realize the US Fed has very high expectations from Wall Street to cut interest rates…a lot. (President Trump too, for that matter).
Don’t hesitate to call or email with any questions you may have. I’m always glad to hear from you.