
Keep it Simple
It was my first car. A used 1981 Datsun 310 GX 5-speed manual, with a sunroof and gold velour seats that immediately needed seat covers to preserve that shiny 80s look.
The stock stereo in the car was not exactly what my 20-year-old mind’s eye had envisioned, so obviously, changing it out for a more “exciting” stereo was my next step.
At 20 years old, when a friend has a “still in the original box” deck to sell for half the retail price, you don’t ask questions about where it came from, you just hand over the money.
Step three was a trip down to the local stereo store for speakers and a sub-woofer.
Now I had everything I needed to rock out in my new car…and no money left to install the unit.
This is where my grandpa Nick came into the picture.
Papa Nick Foglietta was complicated man.
He truly was a self-taught genius/perfectionist who could do anything, and anything he did was done well.
Papa loved electronics and cameras and he loved to completely understand every aspect of how everything functioned.
He had a gentle, patient side to his personality, but Papa also had wicked temper that came out of nowhere from time to time. If he was having a bad day it was wise to keep some distance from him and play outside.
Funny how we remember different themes about people from our past.
Anyway, my fondest memory of Papa Nick from when I was young, is recounting the special relationship I had with him compared to most everybody else in my family.
He loved to teach me and was proud of how I would learn from him.
I would listen, follow his instructions, and gain his trust in the process.
He trusted me with his electronic stuff beyond my young age and he would show me the proper way to use it.
Therefore, you can understand why I had no idea if Papa Nick had ever installed a stereo in a car before, but I had no doubt he would be able to do it.
Not only was he able to do it, but he did an amazing job!
I tell this story because it is representative of a simpler time.
People were cognizant of how much they spent on items. They tried to do things as cheaply as possible. They didn’t just ramp up the credit line every time they decided it was time for something new. Actually, very few people even had lines of credit!
People were nowhere near as exposed to the risk of higher interest rates impacting their cash flow and lifestyle.
Please check out the graphic below.
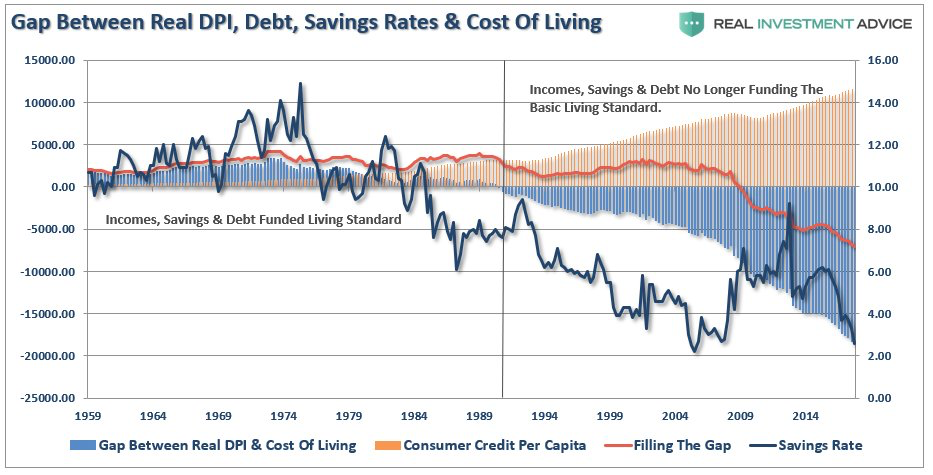
*DPI – Disposable Personal Income
There is a lot of information on this chart. Take your time to look at some of it, but what I want you to focus on is the red “filling the gap” line.
Filling the gap refers how much debt is being taken on by families to balance their household budgets. Simple.
The blue histogram bars plunging to the downside show the trend is not improving; higher interest rates are not going to make this equation balance out any better.
So here is a question: Will families ever choose to go back to a simpler way of thinking about their finances?
My thought is maybe, but not voluntarily.
As asset markets rise, increasing debt is no big deal. It is only when asset prices fall and the proverbial tide goes out, do “we see who is swimming naked,” according to the immortal words of Warren Buffett.
I’m sure many of you can relate to the incredible change we have seen in the attitude towards credit, debt, and money in general over the past generation or so. If you have an interesting anecdote you are willing to share I’d love to hear from you.
Double-Bottom Breakout or Building a Right Shoulder?
The double-bottom base held and the stock markets recovered ground through Thursday of last week.
The most encouraging part of this chart formation is that it significantly lowers the probability of a “crash” in stock prices.
It is also important to see that it in no way signals an “all clear” for the stock markets either.
What I am now watching for is to see if the stock market will create double-bottom breakout to the upside or form a right shoulder to a head and shoulders BULL market top?
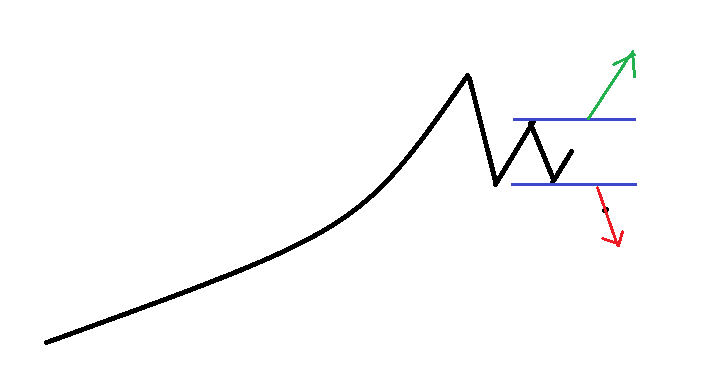
The diagram above shows what either of these two outcomes would look like. The double-bottom breakout would follow the green arrow higher and the head and shoulders BULL market top would end up tracing out the red arrow lower.
The gap between the two lines in blue is basically the war zone for the BULLS and BEARS to fight this battle out within.
Let’s take a look at both the Canadian and US stock markets in light of this chart pattern.
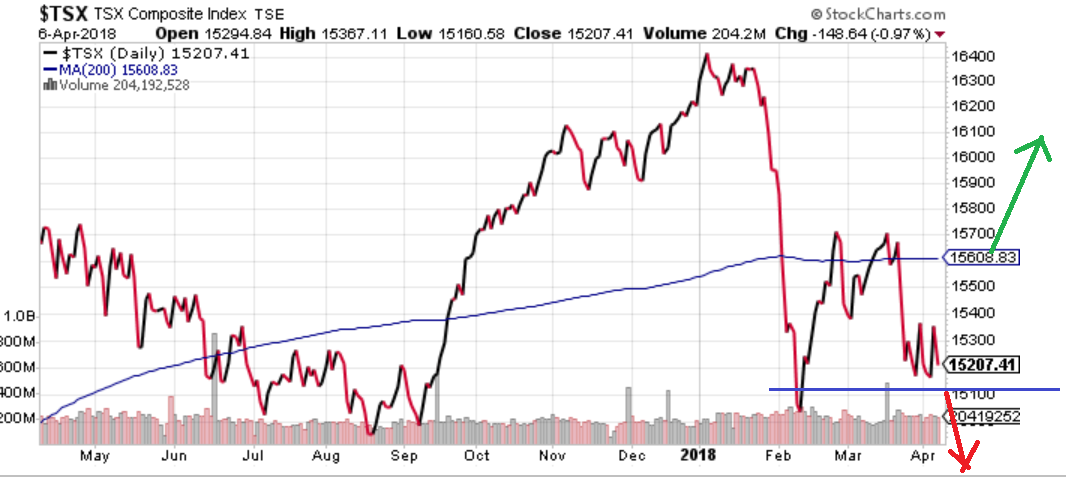
Note, I have added in the same green and red up/down arrows for charts as in the chart example above. The blue 200 day moving average line is the buy signal blue line.

The reality of the two charts is that both Canadian and US stock markets are sitting in neutral positions.
The double-bottom pattern can continue to play out with a continuously rising market. If the result ends up being head and shoulders BULL market top, I would expect the right shoulder in this process to take about two months to complete. If the stock markets are breaking down as I write, then the next level for support comes about 6% to 9% lower where the technical analysis would begin again.
Summary:
The technical condition of the stock market is stronger than the fundamental condition of the stock market.
Since my strategy for managing risk is technical, I will continue to focus on the optimistic outcome. But I am completely aware of the fundamental state of financial markets. The bottom line is we need to be patient, yet defensive.
Stocks are not cheap and interest rates continue to rise. Tax cuts are going to help some on the valuation side of the equation, but it seems the tide is flowing against stocks in more areas today than it has in the past 5 years.
Let me show one more chart that is worth considering.
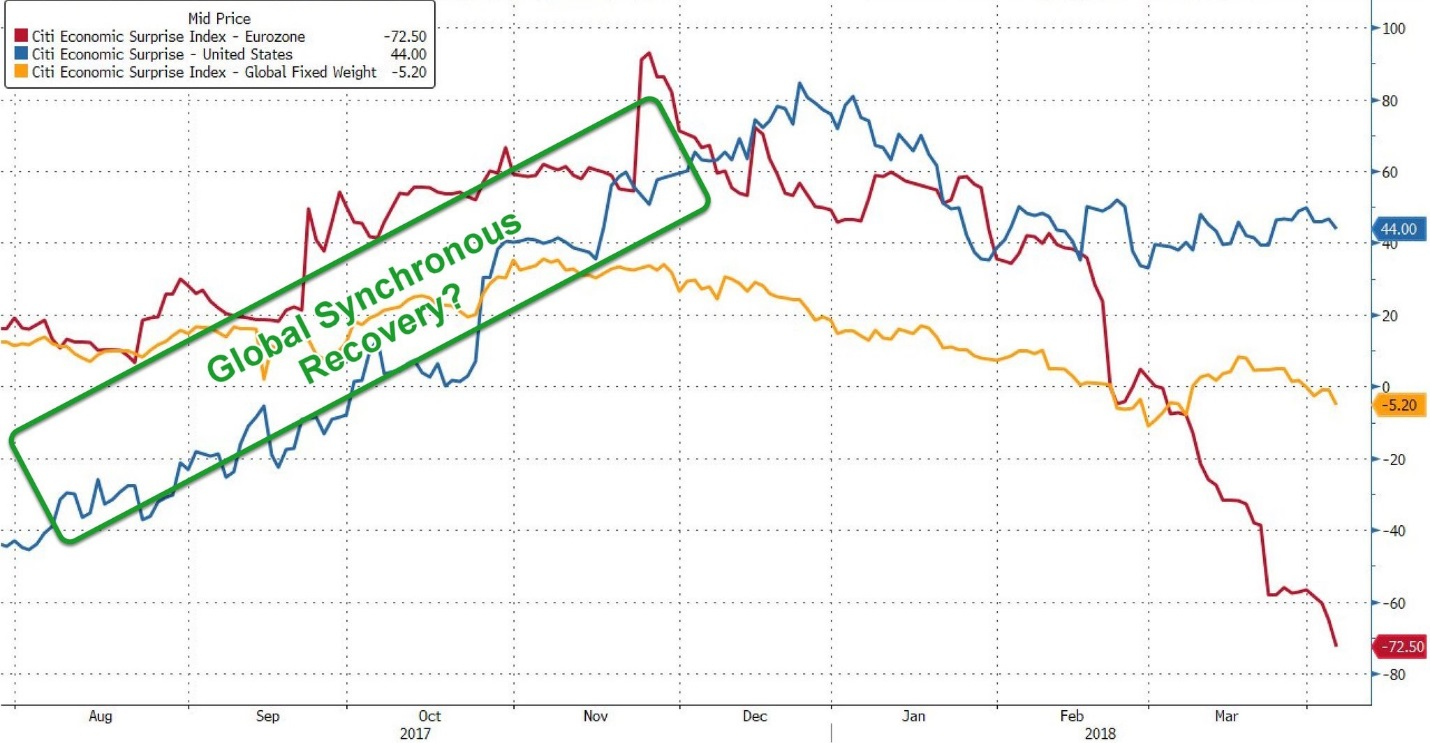
Notice how the “positive economic surprises” in Europe have absolutely collapsed.
One of the things I have been thinking about is: What if Europe starts another recession before they ever get their first interest rate increase in under their belt?
What would be the next step for the European Central Bank to take?
What would that mean for the US Federal Reserve and their intentions to raise interest rates further?
Not much has been talked about in the media about these issues in Europe so I just brought it in for information.
Let me leave this here for now to be reviewed again in future weeks.
Hey, What about Bitcoin?
It seems that the stories about Bitcoin have left the pages of the financial media. I could not turn on my Twitter feed in December without someone telling me that Bitcoin is the future and was going to make every Bitcoin investor rich.
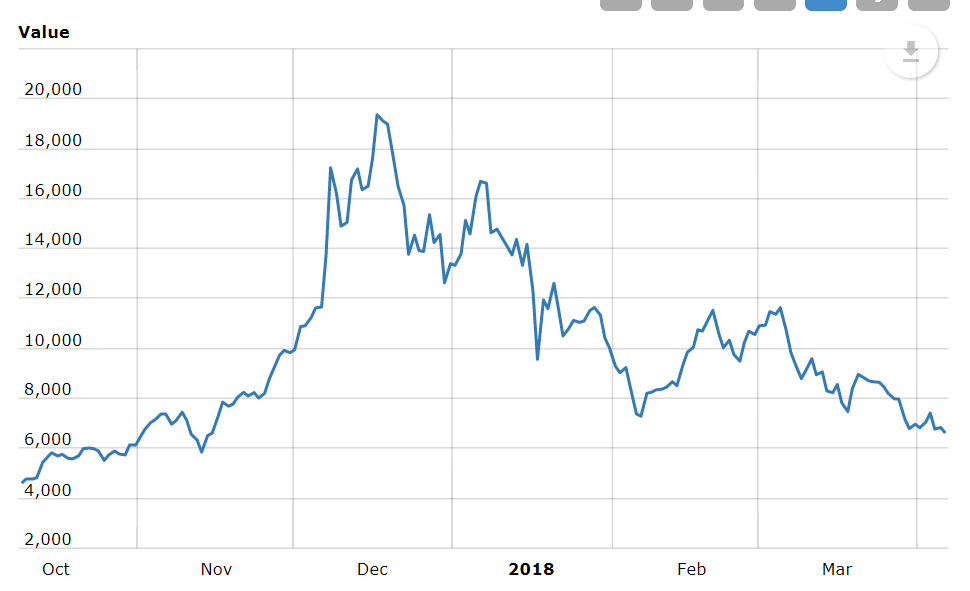
Well, there is not much I can say about that chart other than it looks like every other “bubble” I have seen in the past.
What I want to point out today is not specific to Bitcoin, but to the entire cryptocurrency universe.
In December 2017, at the peak, all the cryptocurrencies total market cap (or total value together) was just shy of $750 billion US. Today, the total value is $244 billion US. That is a loss of value of half a trillion US dollars.
To put that in perspective, the mortgage bubble in 2008 in the US in its earliest stage was about $350 billion US of mortgage losses. Hmmmm?
Again, this has not been widely reported but is interesting to think about.
You can go back in these comments and see that my position on cryptocurrency has always been they are a bubble. What I do believe has a future is blockchain.
As time goes by, I think blockchain might only be the early building block to what really is going to change the way the world works so I am reluctant to even invest here any longer.
Feel free to ask questions about this comment.