
Looking for Clues
Alfred Lee Loomis was an American attorney, investment banker, philanthropist, scientist and inventor. He created the LORAN global positioning system used prior to GPS systems and provided research in the development of radar and the atomic bomb considered vital to winning WW II.
Mr. Loomis is also famous for timing the stock market crash of 1929!
Oh, his timing wasn’t perfect. He was a year early. But he was able to patiently wait in a cash position while the rest of the world went along justifying why the world had changed and these high asset valuations were justified. (Actually, he took a position in Gold and profited from the crash…but that is another story). Below is the Wiki description of how Mr. Loomis handled the times:
In 1928, anticipating the coming Wall Street crash of 1929, he, his partner, and his firm had converted their investments into cash—having determined that the market had risen so dramatically that it was unsustainable and a crash was inevitable. Once the stock market crash had bankrupted the majority of speculators, while Wall Street floundered, he and his firm became even wealthier as a result of purchasing stocks cheaply after they had plummeted in value and few people had the cash to reinvest.
While Senatorial hearings sought to tar him for the success of his prudent strategy, no substantive charges were ever brought. Loomis later worked closely with FDR and his administration in preparing the country's technological base for war, using his many contacts in New York finance, as well as generous sums from his own considerable fortune, to finance the early developments in radar, before government money could be provided.
Why do I bring up this story from "ancient" history?
Because it shows how important it is to not grow complacent, keep using your analytical skills and common sense and not get so deeply caught in the current of common knowledge that you can’t find your way back to the edge of the stream when it is time to swim against the current.
It is not yet time to swim to the edge of the stream. The party in financial assets rages on, but it is definitely the time to keep looking for clues as to when head for shore.
Interest rates:
These first two charts show the yield on the US 10 year Treasury bond and then the spread between the yields of the US 10 year Treasury and the US 1 year Treasury bond.
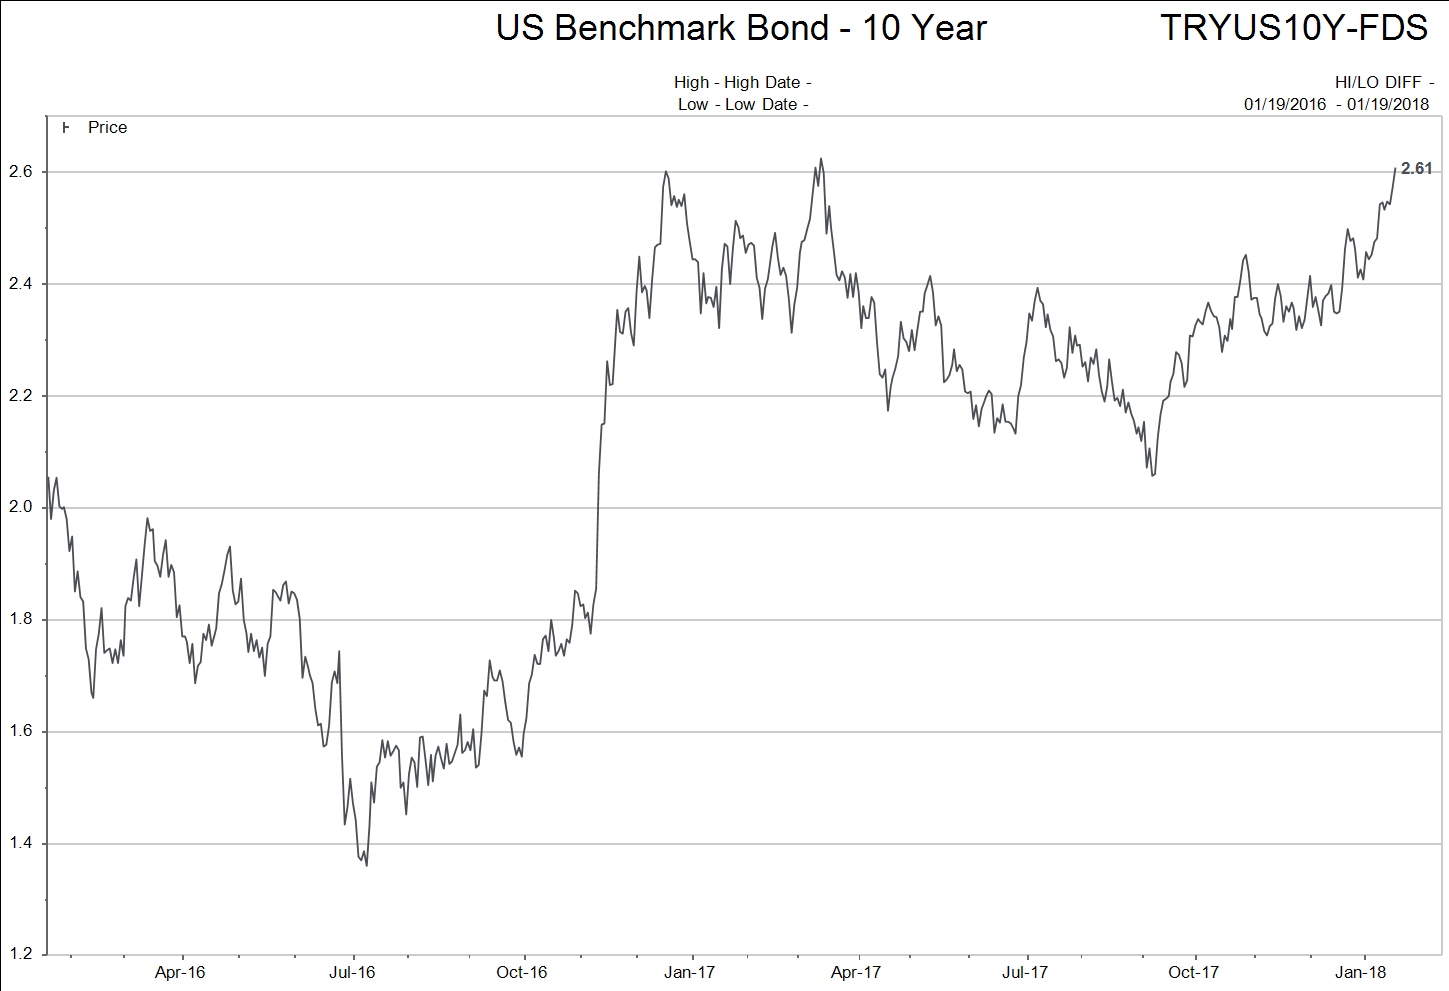
The US 10 year Treasury bond is trying to break out above the two year range.

The chart above shows how the spread between the US 10 year and 1 year has narrowed over the last two years.
Historically, rising interest rates and narrowing spreads have been signs of an economic cycle ending not beginning!
Valuations:
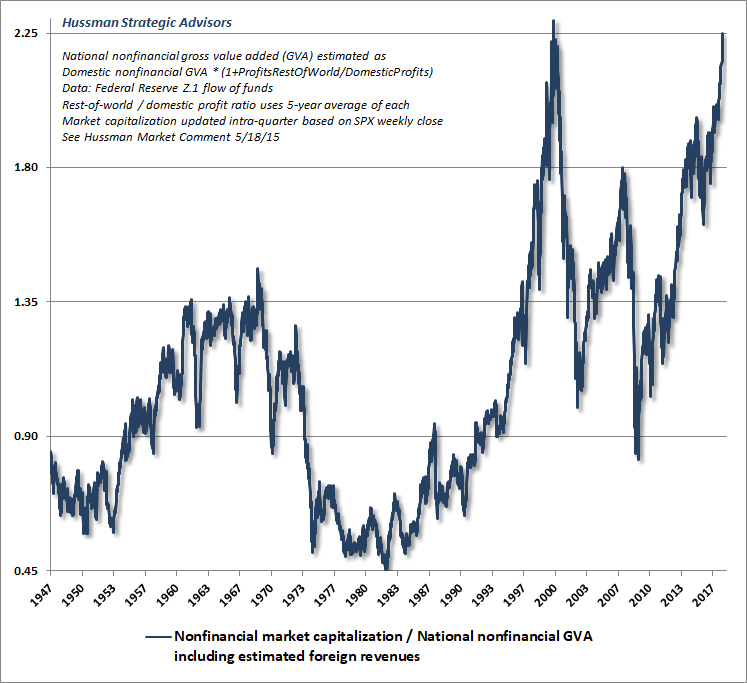
With interest rising, an investor has to consider the long term valuation of an asset class they are considering either holding or investing in.
The chart above uses Warren Buffett’s favourite market valuation indicator as to “cheap” or “expensive” stock prices. Granted, this is a US based indicator and US stocks are more expensive than Canadian stocks, but it is clear that 2017, and the start of 2018, have taken valuations into rarified territory.
One more chart I find interesting is the 90 day chart of the price of Bitcoins below.
This is not a chart I would be tempted to buy. Notice the bottom of the chart where it shows the volume of the transactions in Bitcoins. The highest volumes were near the peaks and the valleys.
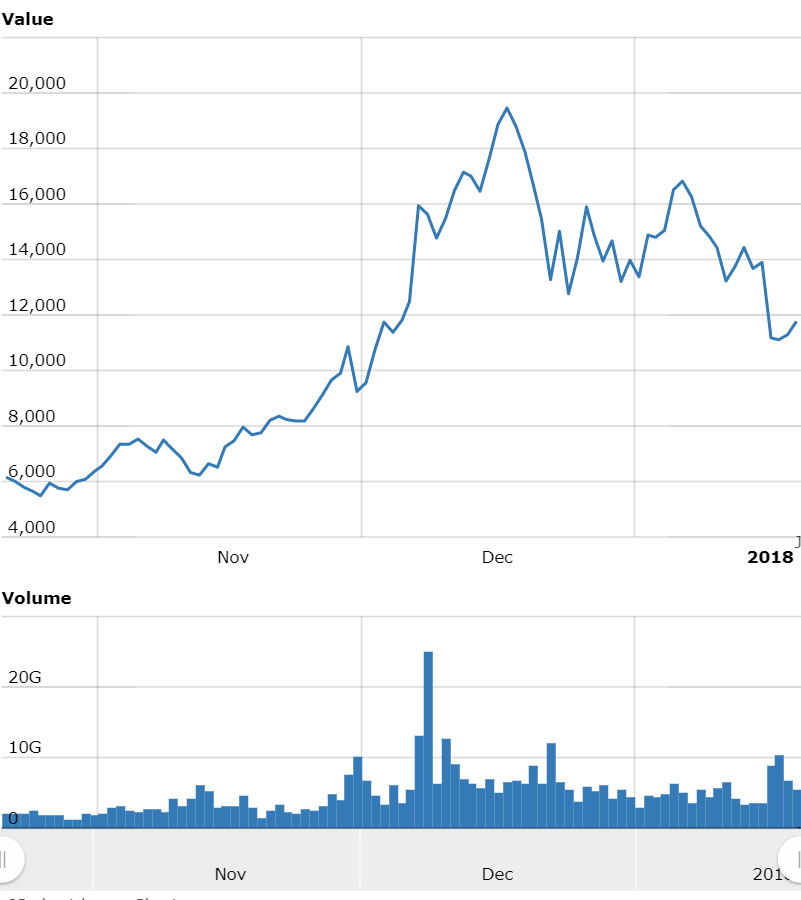
Bitcoin continues to trade like a bubble…not a new currency! Stay tuned!
In summary, there are clues that it is getting more dangerous to stay swimming in the stream!
Remember, at the end of the day, there are only “dead fish” left in the current!
Caveat to Canadian Oil Investing
In my last weekly comment I mentioned oil and gold as charts moving higher. The oil price used was that of West Texas Intermediate Oil.
I just wanted to be clear, those are not the prices that Canadian produces access when selling their oil.
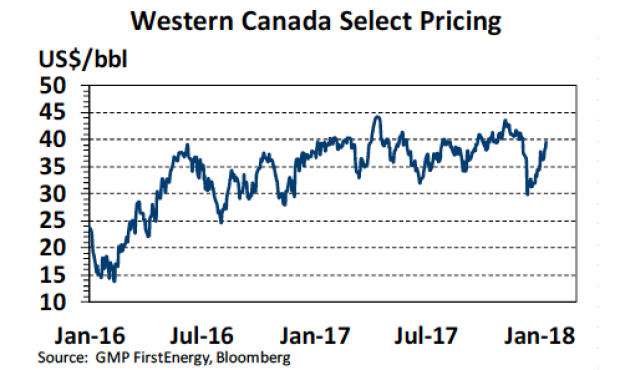
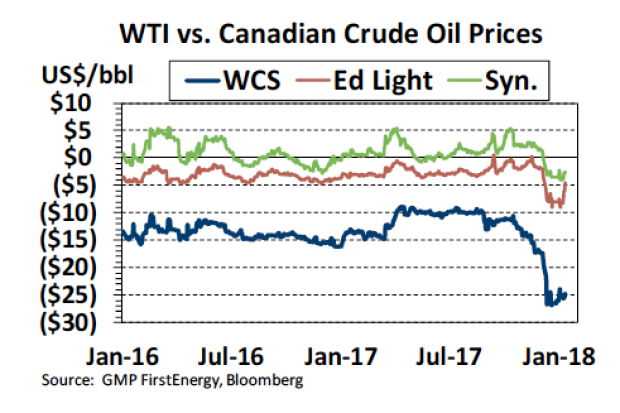 Hopefully, that makes the differences clear. These are significant hurdles that need to be considered when investing in Canadian Oil producers.
Backlash to Big Technology
Also in the last weekly comment, the lead section spoke to the slowly changing attitude towards technology innovations to simply be accepted because technological change is inevitable and how there needs to be more consideration as to long term good for society considered when implementing these changes.
Well, this week the Economist wrote an article on the exact same topic.
If you are interested in the topic, I recommend reading the full article. If you don’t have time to read the article, please check out the one graphic below.
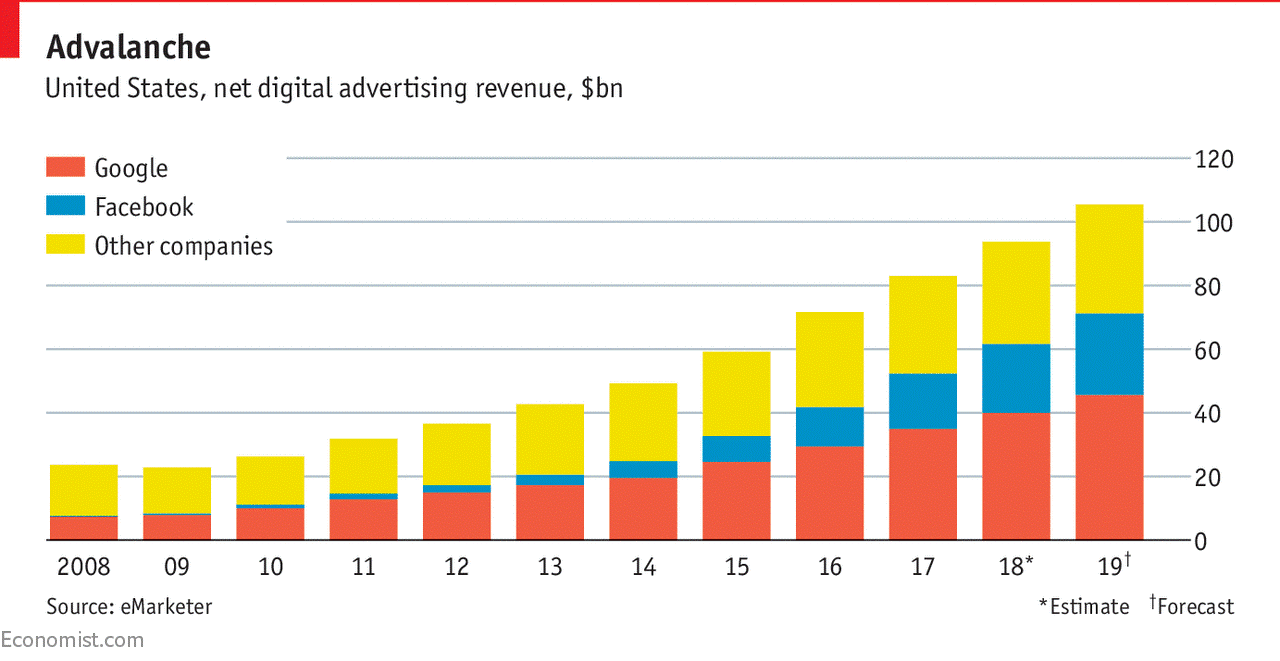
The ability for the large tech companies to dominate a sector is clearly displayed in the graphic above. The same process applies to far too many other areas where large tech appears on the scene, disrupts the balanced market, and changes the rules of engagement.
Have a great week!