
In Search of the 200 Day Moving Average
The “sideways” pattern in place for stock markets since the peak in January 2018 remains valid.
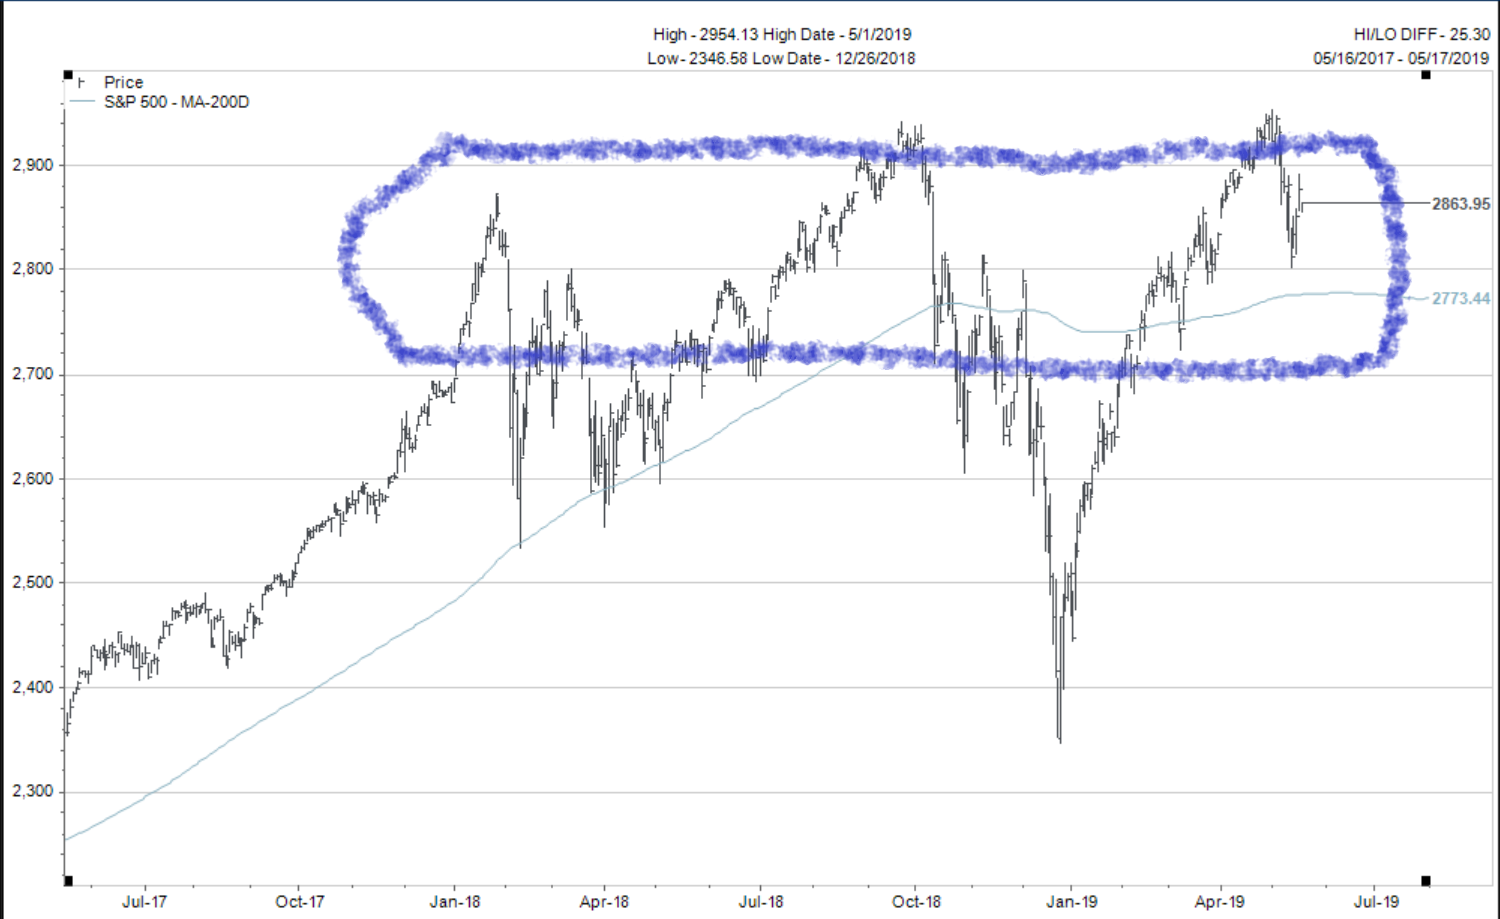
The pastel clouds drawn in the charts below give a short term and long term visual representation of what I am using to define this pattern for both the S&P 500 and the TSX Comp.
S&P500 Short term view:
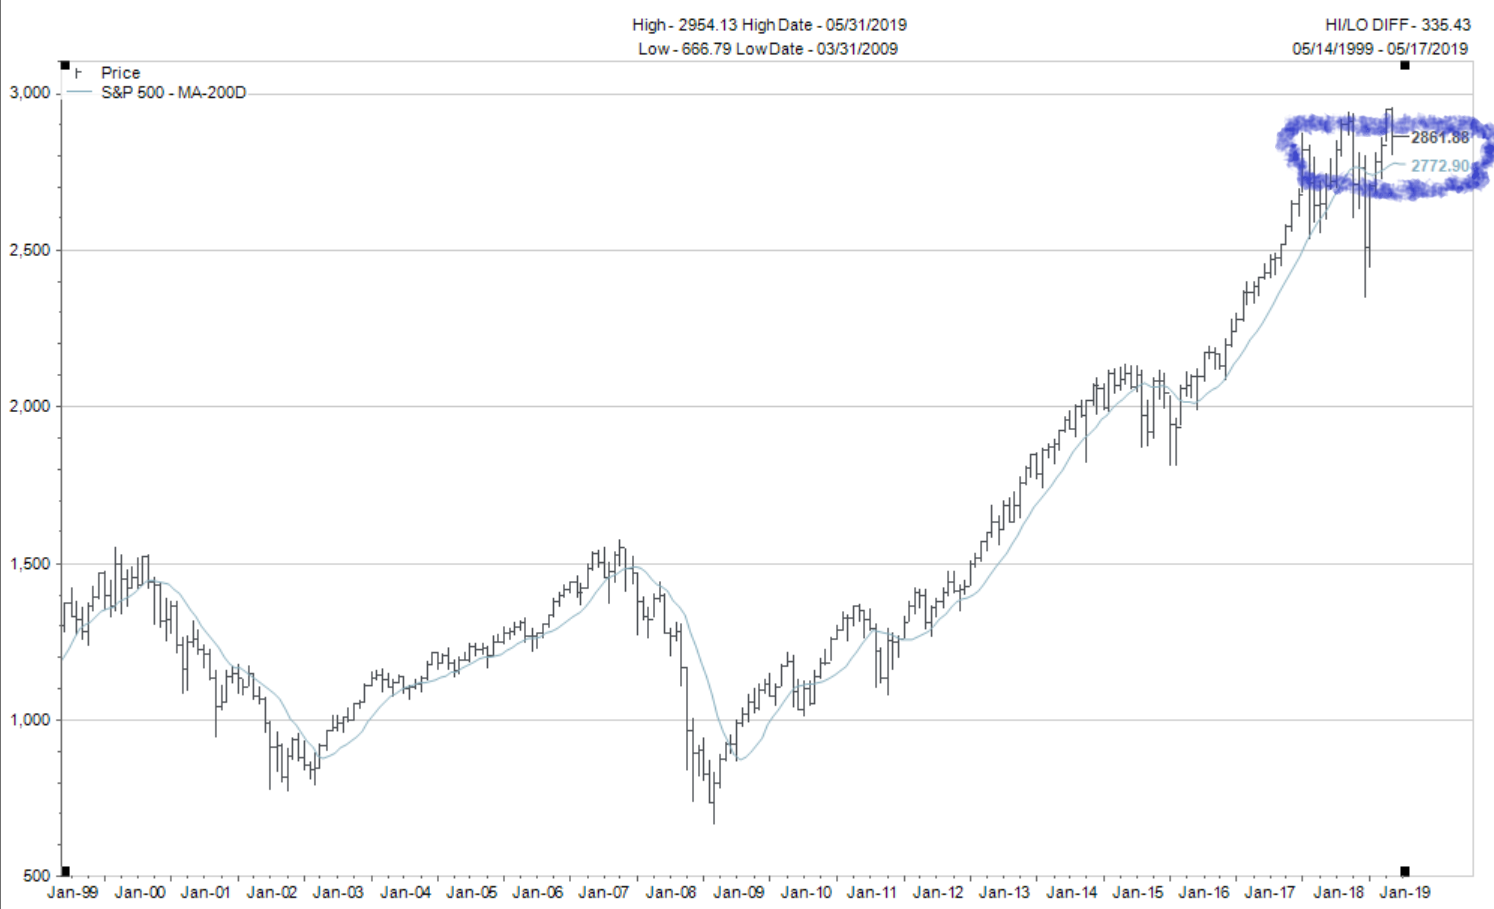
 S&P500 Long Term View:
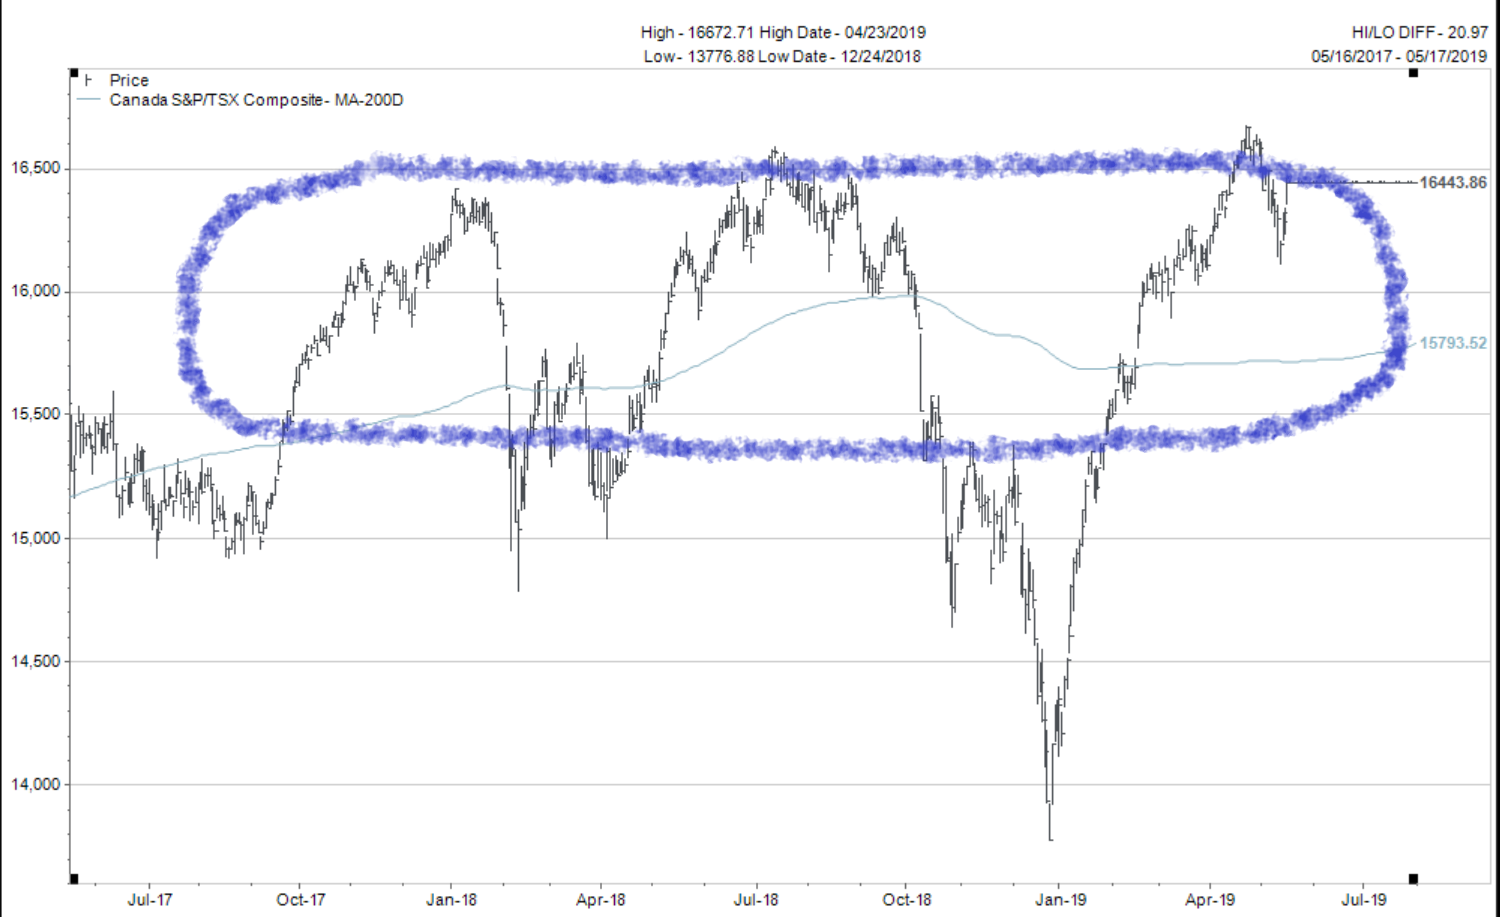
 TSX Short Term View:
 TSX Comp Long Term View:
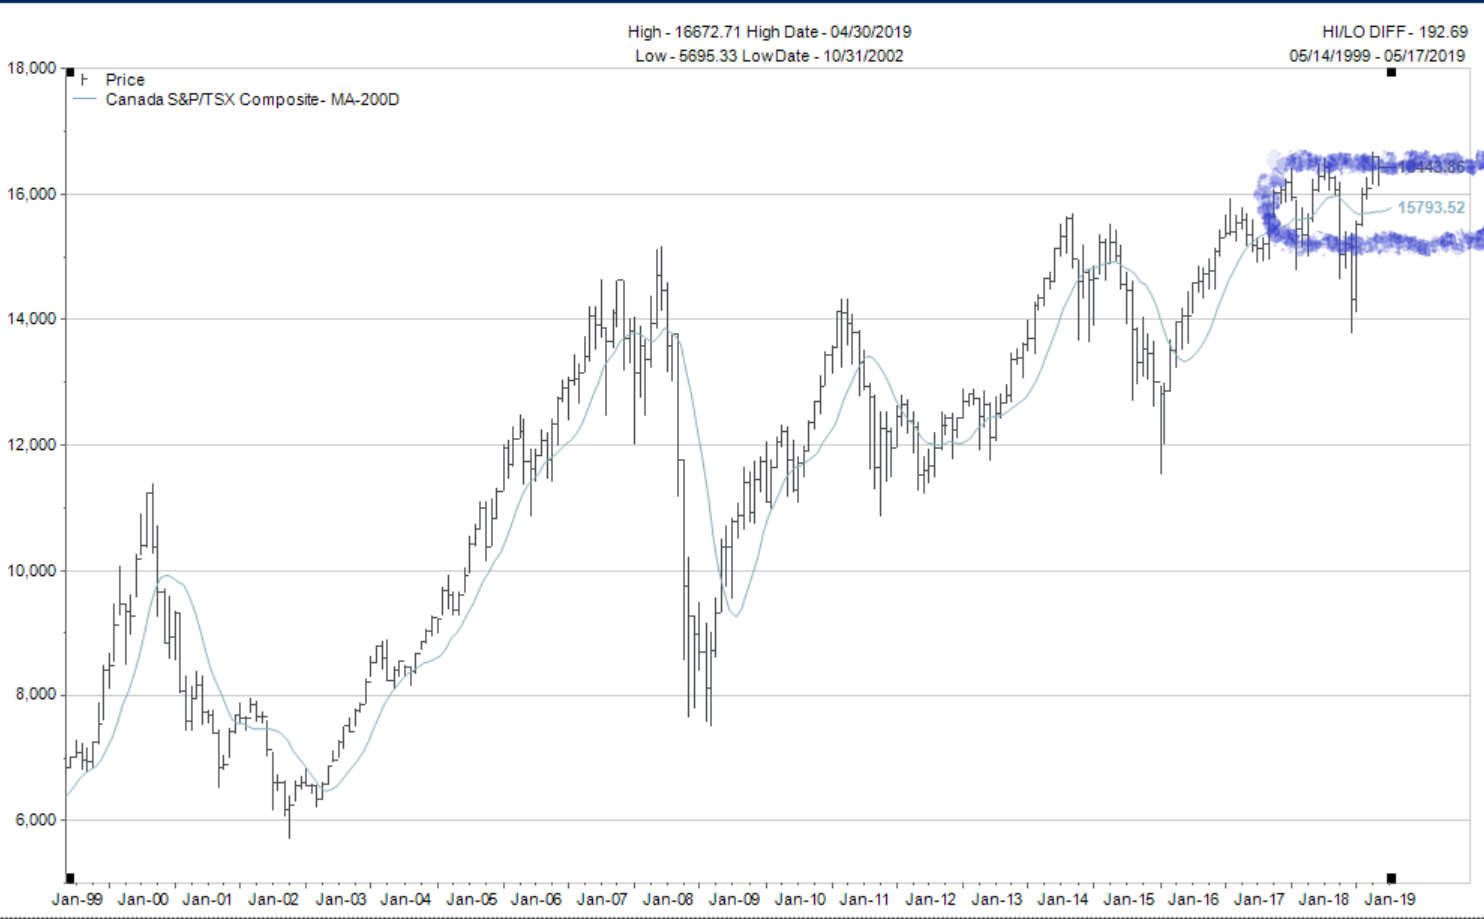
One could argue the TSX Comp has been sideways for 10 years, but that is another story for another editorial.
The primary outcome focus remains BULLISH since both markets are above their respective 200 day moving average lines (blue on the charts).
The even lower interest rates expected lead me to the following “rough” targets for the S&P500 and TSX Comp: 3600 on the S&P 500 and 19,270 for the TSX Comp before the end of 2020.
The BEARISH secondary focus would only come into play IF the two stock indexes drop below the 200 day moving averages.
But even the BEARISH outlook has been tempered in expectation of central banks being quick to cut interest rates to halt any market decline.
For the present time the technical outlook requires mostly patience. Let these patterns resolve themselves in coming weeks and months.
US/China Trade Talks
The reason I have not spent much time writing about the US/China trade talks is there is really no way to “handicap” an outcome from the negotiations.
Ben Hunt of Epsilon Theory made the statement months ago, “Trying to forecast the results of the trade talks is like guessing the winner in a game of Chicken.” (You know, the game where two cars drive directly at each other in the same lane and the first person to swerve out of the lane is the “chicken”).
This example maybe a bit extreme but worth considering…
My expectation for the US/China trade deal was and continues to be for some kind of “agreement in principle” to be announced that does not go far enough to address the real issues that were originally on the table to be solved.
I’m sticking with that perspective.
The headlines and Tweets continue to try to keep everyone believing a meaningful deal is still possible. I guess anything is possible, but the chances of a meaningful deal taking place now are lower than they were three weeks ago with all parties stepping back from the process.
Again, we are just watching and waiting for some certainty.
Canadian Real Estate
There are a number of signs of stability showing up in the Canadian real estate statistics.
A quick review is in order.
As interest rates were increased during 2016 and 2017, real estate in Canada was weakening…significantly in sales volume and moderately in price.
The government “Stress Tests” compounded the challenges for Canadians buying real estate to the point that by the end of 2018 there was a significant risk of a large decline in prices to match the declines in sales volume.
But since the beginning of the year the markets have slowly improved in tone aided and abetted by the declining trend in interest rates profiled in the lower window below.
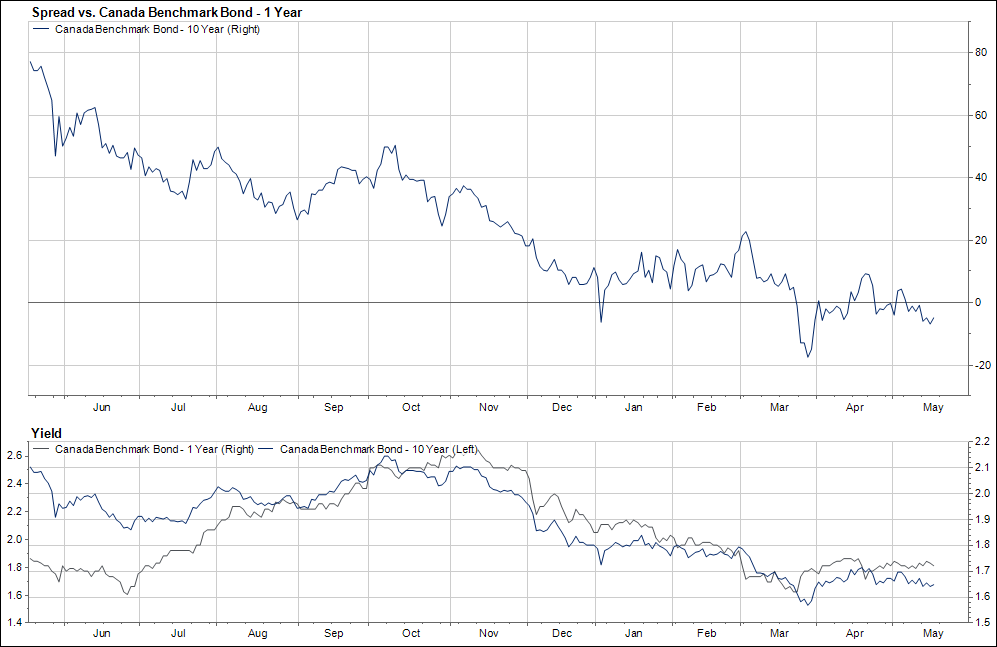
Let’s take a closer look at the data in the chart above:
-
In the lower window, the yield on the 1 year Government of Canada Bond in black on the right scale.
-
In the lower window, the yield on the 10 year Government of Canada Bond in blue on the left scale.
-
In the top window the yield difference between the 10 year yield and the 1 year yield. (Note, it is now a negative number which means the yield curve is “inverted”).
The lower interest rates are welcome news for overly indebted Canadians. As a matter of fact, the first green shoots of Canadians ramping up their levels of debt even higher are showing in the most recent data.
Please note, if interest rates fall another 50% from the present levels in the coming three years (which I totally expect), real estate prices will be well supported with floating mortgage rates maybe falling to the 1.4% to 1.65% range.
This forecast needs more time to play out. April, May, and June are the strongest months of the year for real estate sales so it might just be seasonal factors making the “bottom” for real estate look plausible.
That said, much lower interest rates might be just enough to get people excited again and ready to take the plunge on purchases. The lower rates will definitely get investors looking around for alternatives when they can only get 1% to 1.75% on their GIC investments and bonds.
The world changed in January 2019. This is another example of the change that was make.