
U.S. earnings have brought a mix of highlights and lowlights. Let’s examine these opposing forces, how the Magnificent 7 narrative may change in coming quarters, and how to adjust equity exposure in this unique period.
The S&P 500 had mounted one of the best two-quarter rallies in history. Optimism among industry analysts prevailed.
The Q1 consensus forecast hadn’t drifted down as much as it normally does in the weeks preceding the reporting season. This raised the bar for S&P 500 companies and left the index vulnerable to a pullback if high-profile firms stumbled. Right out of the gate, that’s exactly what happened.
The market sold off following JPMorgan Chase’s less-than-perfect earnings report. This misstep, combined with messy inflation data, a jump in Treasury yields, and a shift in Fed rate cut expectations, pulled the S&P 500 down 5.5 % from its all-time high.
But since the latter part of April, the U.S. equity market has bounced back as the earnings and revenue growth pictures brightened and Treasury yields settled down.
With 91 % of S&P 500 compani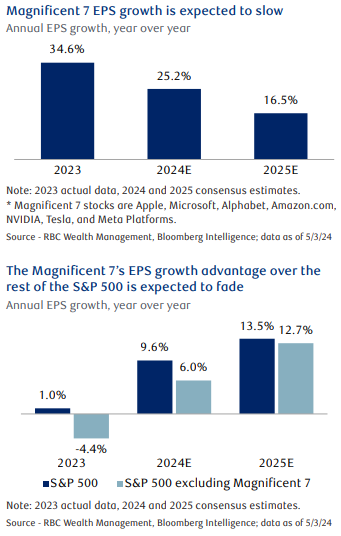 es having reported Q1 results thus far, there have been some notable highlights:
- S&P 500 earnings per share (EPS) growth of 7.1 % well exceeds the 3.8 % Bloomberg consensus forecast when the earnings season began.
- Nine of the 11 sectors are beating the pre-earnings season consensus EPS forecast. Energy is roughly in line. Health Care is the only sector lagging, but it’s lagging badly.
- The magnitude of earnings beats slightly exceeds the past four-quarter average and is well above the long-term average.
- No surprise, technology-related stocks including the Magnificent 7 are leading with the strongest EPS beat rates. But other sectors, such as Financials, are also contributing, which is a positive sign.
- Revenue growth, which got off to a slow start, has risen to 4.2 %, in line with Q4 2023 growth. Also, a variety of sectors are exceeding the S&P 500 revenue growth rate.
- The full-year 2024 EPS consensus estimate is holding up well at $245 per share, as measured by Bloomberg. This is roughly flat compared to the forecast last summer. Normally at this point in the calendar, the full-year estimate has retrenched by about 5 %.
- Profit margins remain high for the S&P 500, technology-related stocks, and cyclical (economically sensitive) stocks. But margins for non-cyclical stocks are very low.
The Q1 earnings season has also included some lowlights:
- Reactions to Q1 reports, earnings beats have been rewarded less and earnings misses have been punished more than usual.
- Earnings and revenue growth are once again skewed toward the Magnificent 7 stocks, as are upward revision trends for future quarters.
- Magnificent 7 stocks are growing Q1 EPS by 49.3 %, whereas EPS growth for the rest of the market has declined by 1.3 %, according to Bloomberg Intelligence data.
- EPS growth for growth stocks is trouncing value stocks by 42.1 % to -4.5 % mainly because of the Mag 7 effect.
- There are very wide differences in sector EPS growth, with Communication Services, Consumer Discretionary, and Information Technology all growing EPS by over 20 %—again, thanks partly to Mag 7 stocks. But Utilities is also seeing EPS growth above 20 %. In contrast, EPS growth has declined by more than 20 % for Health Care, Energy, and Materials.
Later this year and next, the Mag 7 narrative could shift. Mag 7 earnings growth is forecast to decline meaningfully from 2023 to 2025, as the middle chart shows. This is due to difficult year-over-year comparisons and the law of large numbers. The bigger and more mature a company gets, the harder it is to deliver dramatic earnings growth year after year.
At the same time, earnings growth for non-Mag 7 stocks is expected to rise.
If this plays out, the Mag 7’s advantage should fade, as the bottom chart shows. We think forecasts for the non-Mag 7 stocks are highly dependent on economic trends. If GDP growth decelerates meaningfully later this year, non-Mag 7 stocks and the U.S. equity market as a whole could run into some bumpy patches again.
The consensus forecast for U.S. GDP growth is 2.4 % in 2024 and 1.7 % in 2025. Historically, annual GDP growth above 2.0 % tends to correspond to above-average S&P 500 gains, according to a study by RBC Capital Markets U.S. Equity Strategy. However, when GDP was within a more sluggish 0.1 % to 2.0 % zone, the equity market often declined.
On one hand, further upside potential for the S&P 500 exists, due to favorable consensus earnings growth forecasts for the index and most sectors. Portfolio exposure should factor in economic risks that stem from today’s unique period. The U.S. economy is still adjusting to the Fed’s aggressive rate hike cycle that followed significant pandemic-related stimulus.
We recommend maintaining Market Weight exposure to U.S. equities in order to balance the risks against the potential that the economy and S&P 500 earnings could prove to be resilient.
As always, please let me know if you have any questions or comments.