Chart of The Week
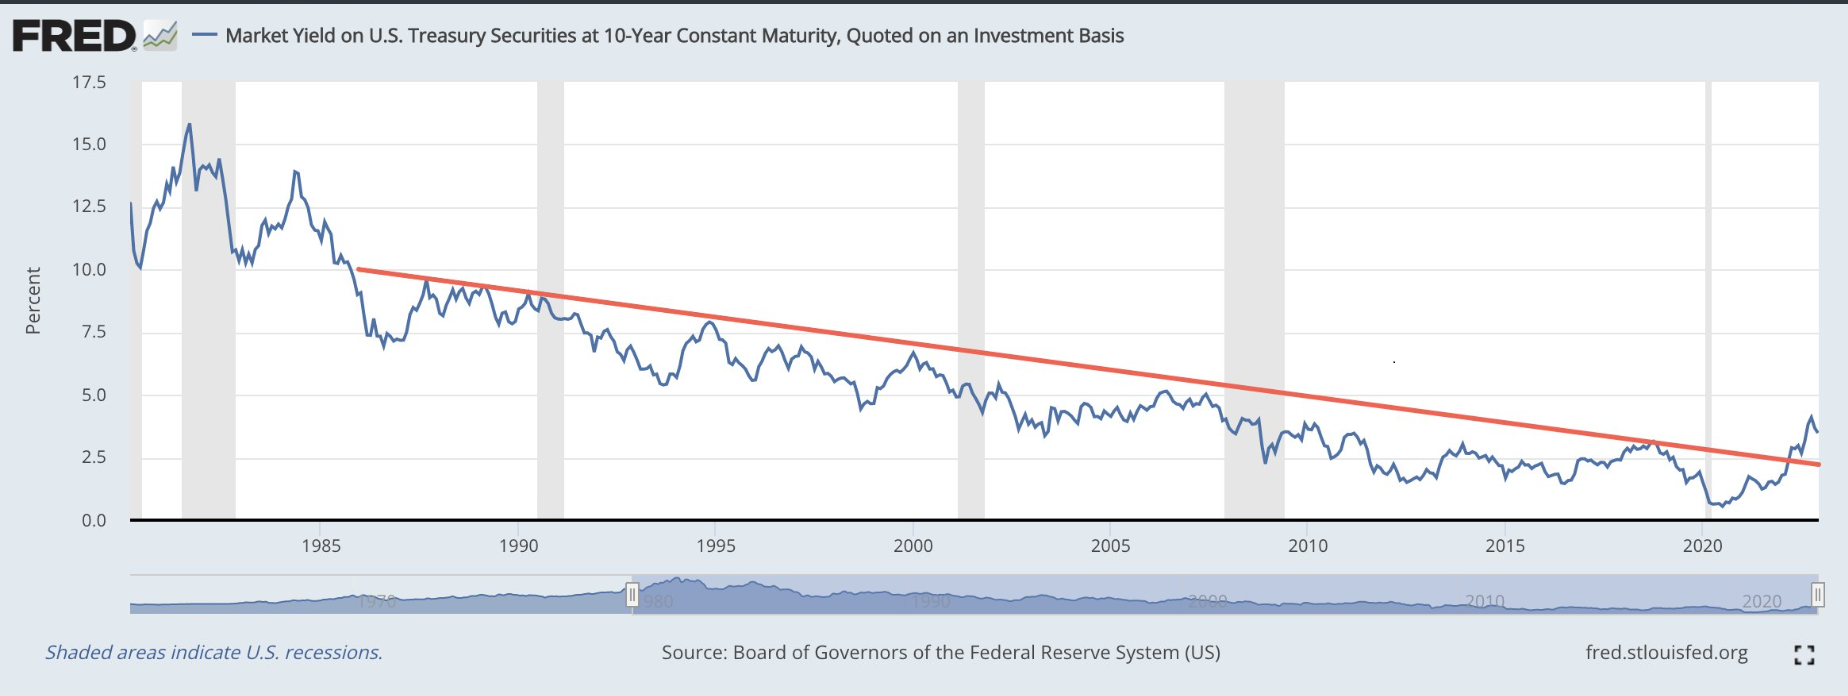
Market Yield on U.S. Treasury Securities
We are often asked about asset bubbles and how they are created. The easy answer is that human psychology towards an asset class moves from fear to greed and back again over time. Often the fuel is “easy money”; essentially, very loose monetary conditions. The chart below is the market yield on the 10 year U.S. Treasury bond, from 40 years ago to present. As one can see, until recently, it has been in a one-way trend towards lower rates.
With this belief in “free money” due to low interest rates, came the expansion in values of various asset classes— whether we consider stocks, bonds, real estate, art, or used cars, many asset classes benefited from this period of exceptionally cheap credit. Fast forward to today, and those conditions have changed drastically, and have resulted in the repricing of many assets.
The question we all ask is “where will the dust settle on interest rates”? We would argue that interest rates still have some upside, meaning that they can still rise, and the aforementioned asset classes could be at risk of further repricing. As we enter 2023, we will be keenly watching how the economy and corporate earnings are weathering the storm in a higher interest rate environment.