
Economic Overview
Heading into the year we were quite concerned about a global slowdown and in particular, the lagged effects of elevated inflation and borrowing costs. Fortunately, our worries have yet to materialize and in fact the opposite has occurred. So far, this year has delivered broad-based upside growth surprises. Despite the near-crisis event in the U.S. banking system, Q1 2023 global growth projections have moved up a full two percentage points since the beginning of the year and now sit at a robust 3.7% (annualized rate, JPMorgan). China’s reopening, mild winter weather, decelerating inflation and strong labour markets all boosted activity. The latest readings from JPMorgan’s Global Composite PMI, a survey of 27,000 companies, indicate more strength in the very near term for the global economy.
Figure 1: J.P.Morgan Global Composite Output Index (green line) and Global GDP growth
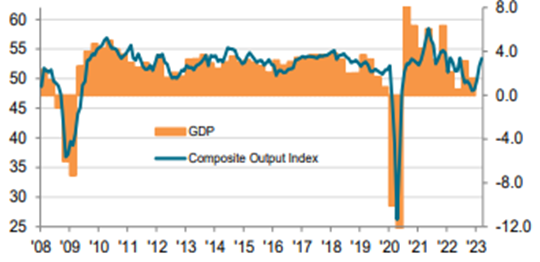
Source: J.P.Morgan, S&P Global
Can this strength be sustained? We see a very mixed picture. Inflation is heading in the right direction providing much needed reprieve for businesses and households. Wage growth is still strong, and for the first time in two years U.S. workers are seeing their pay increase faster than inflation (Figure 2).
Figure 2: U.S. real wage growth
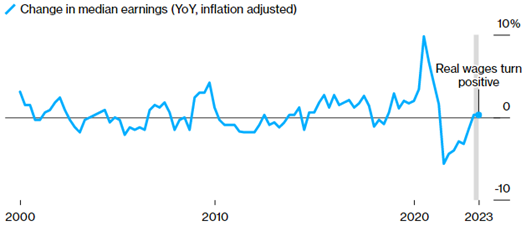
Source: BLS
What’s more, equity markets and real estate prices have held in remarkably well despite the meteoric rise in borrowing costs. Higher wealth should support household consumption. Consumers are still benefiting from excess savings accumulated during the pandemic (Figure 3). These are, however, dwindling in the U.S. and we would expect the same around the world.
Figure 3: Excess household savings during pandemic
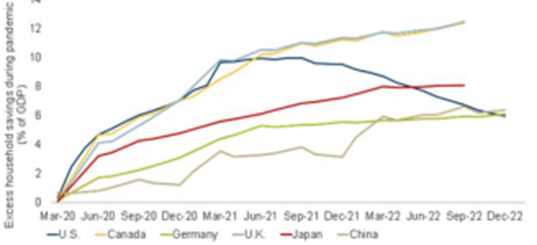
Source: Bank of Canada
The labour markets are supportive of the economy, too. In the U.S. there are roughly 1.7 jobs available for each unemployed person (Figure 4).
Figure 4: U.S. job openings/unemployed persons
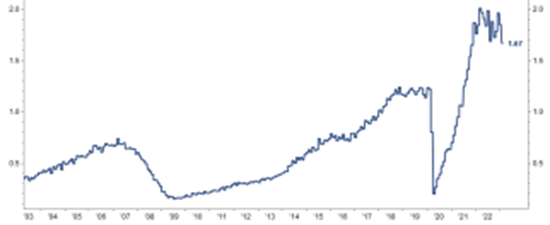
Source: FactSet
These data points make it easy to paint a rosy picture, but we also see a few causes for concern. First and foremost, interest rates. The recent economic strength has come with an unwanted side effect, firming underlying inflation. Despite year-over-year inflation coming down quickly, month-over-month prints are still quite high. This could keep central banks holding their policy rates higher for longer, prolonging the difficulty companies and households are having accessing capital. Even if this doesn’t happen, we think there are some lagged effects of higher interest rates that will be felt in the coming quarters. The following chart from RBC Economics highlights this well, showing how household debt service ratios are set to adjust materially higher as mortgages and floating debt reset (Figure 5).
Figure 5: Canada debt servicing ratio and BoC rate
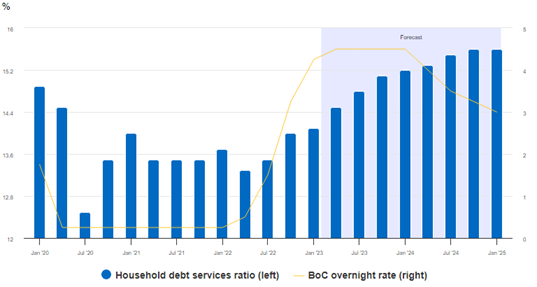
Source: StatCan, RBC Economics
Lower quality corporate borrowers will also struggle as lending standards for commercial and industrial loans are tightening (Figure 6). This type of behaviour from lenders has historically preceded recessions.
Figure 6: Percentage of banks tightening standards
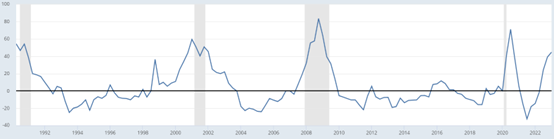
Source: Board of Governors of the Federal Reserve System (US)
Some of this tightening was accelerated in the wake of the recent U.S. bank failures. We won’t delve into that issue but will mention it appears to be contained. Swift action from regulators has restored faith in deposit safety and the failed banks were outliers from the group, characterized by large un-hedged bond losses and/or a high percentage of uninsured deposits (Figure 7).
Figure 7: Failed banks had high unrealized securities losses (left) and/or high uninsured deposits (x axis)
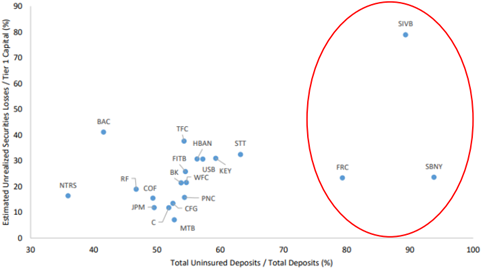
Source: RBC Dominion Securities
Putting it all together, the outlook is mixed. Our sense is the China reopening effect may prove to be short-lived and economic growth will ultimately surrender to high interest rates. Yes, several central banks have already paused their rate-hiking cycles, but it’s difficult to see meaningful rate cuts unless it’s in response to economic weakness. Fortunately, we don’t see many cracks within consumer fundamentals and think households are in a good position to weather a slowdown.
Equity Commentary
Equities started the year with a stellar quarter and non-Canadian equities led the way (Figure 8).
Figure 8: Benchmark equity returns in $CAD
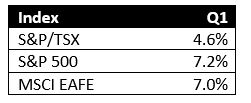
Source: RBC Capital Markets Quant Research
Returns were not evenly distributed. In the U.S. for example, the top 20 stocks (including Apple, Alphabet, Microsoft, Meta and Tesla) accounted for over 90% of the index’s return. These companies were hit particularly hard last year which has been, in part, reversed with their recent outperformance.
As is the case with the global economy, the outlook for the markets is cloudy. For starters, valuations in the U.S. (S&P 500) are trading at a premium to the long-term average (Figure 9). Canadian (TSX) valuations are more palatable and roughly in-line with the average.
Figure 9: S&P 500 price to earnings ratio
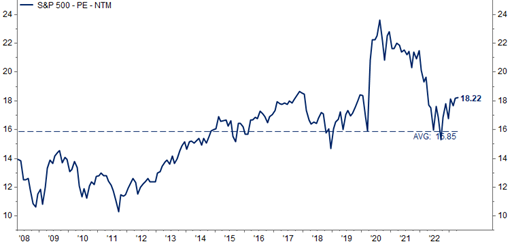
Source: FactSet
Valuations are closely linked to interest rates and the two have an inverse relationship. If inflation declines to target (2%) or lower, interest rates will almost certainly decline. While this is good for stocks, it appears market valuations are already pricing some of this in (Figure 10). Investors may not be leaving much room for error or accounting for potentially stickier inflation.
Figure 10: S&P 500 P/E ratio and U.S. 10 yr yields (orange, left side, inverted axis)
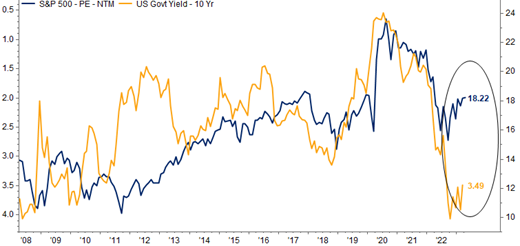
Source: FactSet
Valuations only tell part of the story and aren’t all that useful on their own. Earnings growth will ultimately determine where stocks are heading, and right now analysts are predicting roughly flat (zero) earnings growth this year for the S&P 500. This estimate has been declining, last April 2023 growth expectations were around 15%. What happened? Sales growth is slowing, and after reaching an all-time high last year, net margins are contracting… a very difficult combination for the bottom line. Still, analysts are overlooking flat growth this year and focusing on 2024 (Figure 11). As you can see, those numbers are fairly optimistic, with analysts expecting 12% growth in 2024 and 11% in ‘25. Keeping in mind that EPS growth averaged 8% over the pre-COVID decade, forward estimates appear aggressive from here. We have a hard time conceptualizing how these can be achieved in the face of a slowing economy and corporate margins near all-time highs.
Figure 11: S&P 500 EPS growth
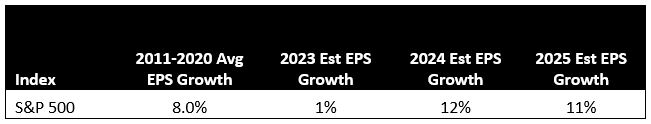
Source: FactSet
It is important to note that we do not anticipate a major market correction or economic derailment. Instead, we think the markets are trading near fair value and see a very real possibility of below average returns for the foreseeable future. Against this backdrop, we think conservative positioning in portfolios is warranted and are currently underweight equities. Good quality fixed income is offering competitive returns of around 5-6% and a much higher degree of safety.
Equity trading was light during the quarter. We exited our position in Choice Properties in January. Choice is Canada’s largest Real Estate Investment Trust with 700 income-producing properties originally spun out of Loblaw in 2013. The stock appreciated 25% from October to January reaching fully valued levels in our opinion.
We purchased three structured notes during the quarter. They each have a five-year term and are linked to a specific equity basket – banks, pipelines and utilities, and yield 7.5%, 8.1%, and 7.6% respectively. The income streams are guaranteed by RBC. The principal to be received at maturity is linked to the performance of the equity baskets, and if the baskets are down no more than 30%, the principal is fully protected. We consider these safer than owning the underlying equities as, for example, you would have no downside protection if you directly owned shares of TD Bank, Royal Bank, and BMO, and they pay a lower yield. We purchased these early in the year when rates were near peak levels and spreads higher. There are no additional fees for these notes.
Fixed Income
Interest rates moved a bit lower during the first quarter and the Canadian Broad Bond Composite increased 2.9%. We continue to see a strong case for holding fixed income in portfolios. Yields are still near decade-highs as can be seen in Figure 12.
Figure 12: Government of Canada 10-yr bond yield
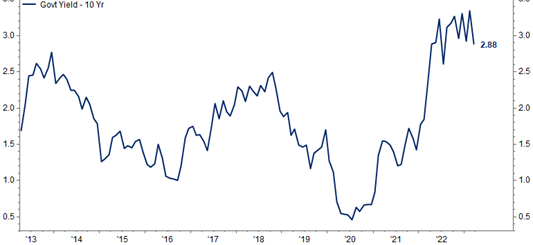
Source: FactSet
Client portfolios hold a combination of federal bonds, corporate bonds, preferred shares and GICs yielding around 5% on average. We see little reason to take on credit or duration risk in the fixed income space, particularly when high-quality, short and medium term notes offer such attractive yields. As a result of higher interest rates, the opportunity cost of owning fixed income is much lower today than it has been over the past decade. Considering the blurred outlook for equities, we continue to overweight fixed income in client accounts and wait for more clarity or a better entry point for stocks.
Performance
In the first quarter of the new year, client balanced portfolios fully invested to model produced strong returns but underperformed their benchmark return of 4.6%. Fixed income holdings in client portfolios performed in line with the 2.9% benchmark return. Preferred shares benefited performance and were up roughly 6.5%.
Canadian equity holdings underperformed the 4.6% total return from the S&P/TSX Index during the first quarter. Real Estate and Utilities holdings led the way with strong gains from Canadian Apartment Properties REIT (+11.1%), Emera (+7.3%), Hydro One (+6.1%) and Choice Properties (+5.0% until sold). Hurting relative returns was Toronto-Dominion Bank (-7.7%) due to its U.S. banking exposure. Commodity-related stocks pulled back a touch after a very strong end to 2022. Copper and coal miner Teck Resources (-3.6%), oil producer Suncor (-2.3%), pipelines Enbridge and TC Energy (both -2.6%) weighed on returns. Teck rebounded very strongly early in the new quarter as of the time of writing on speculation that they could be bought by a competitor.
Our U.S. holdings underperformed the benchmark S&P 500 Canadian dollar total return of 7.2% during the period, a gain that was delivered by a very narrow set of stocks. Portfolios saw strong returns from Microsoft (+20.0%), Google-parent Alphabet (+17.1%) and Walt Disney (+15.1%). Providing a headwind to relative returns was Truist (-20.9%), which was dragged down with other regional banks after SVB Financial collapsed. Johnson & Johnson (-12.1%) retreated along with the Healthcare sector in general.
We held no international equities in our balanced model during the first quarter, which was a drag on relative performance as the benchmark MSCI EAFE Index returned 7.4% in Canadian dollars.